
Figures & data
Table 1 People’ Characteristics
Figure 1 Flow diagram of our study.
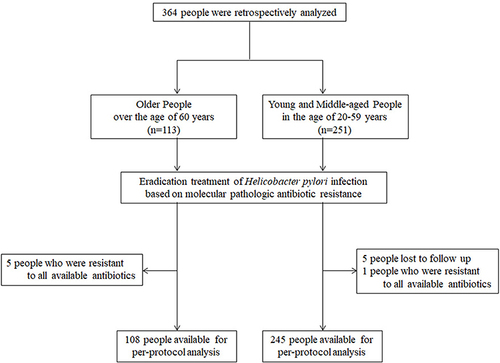
Table 2 Molecular Pathologic Antibiotic Resistance of H. pylori Infection
Figure 2 The prevalence of molecular pathologic antibiotic resistance in elderly people. The black histogram indicates the percentage of antibiotic resistance in older people over the age of 60 years and the gray histogram indicates the percentage in young and middle-aged people in the age of 20–59 years. As shown, the resistance rates to clarithromycin, amoxicillin, fluoroquinolone and tetracycline were 62.39%, 9.09%, 69.64% and 22.45% in older people, and the rates were 66.26%, 6.85%, 57.66% and 19.47% in younger people, respectively. Significant difference was only found for fluoroquinolone (P=0.031). Data were available in the 352, 358, 360 and 324 patients for the above four antibiotics. *P<0.05.
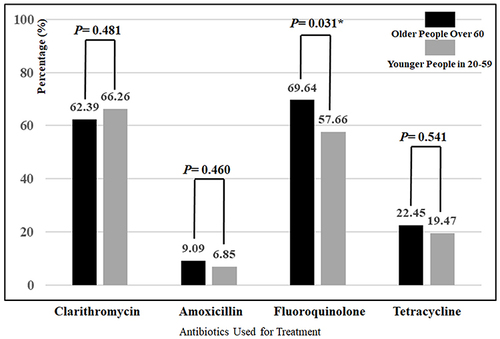
Table 3 Eradication Treatment Regimens of H. pylori Infection
Figure 3 Eradication rates of H. pylori treatment based on antibiotic resistance in elderly people. The black and gray histograms indicate the eradication rates in older people over the age of 60 and in young and middle-aged people in the 20–59.
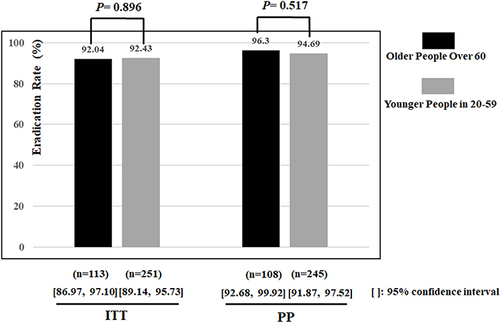
Table 4 Adverse Events and Safety