Figures & data
Table 1 Basic Parameters and Cerebrospinal Fluid Parameters Between Neurosyphilis and Central Nervous System Latent Syphilis Patients
Figure 1 The cerebrospinal fluid markers of nucleated cells (A), red blood cells (B), CSF-TRUST(C), LDH (D), chloride (E), glucose (F), Totalprotein (G), IgG (H), microalbumin (I) from neurosyphilis and latent syphilis infection in the central nervous system are analyzed. *, P<0.05; **, P <0.01; ***, P <0.001; ****, P <0.0001.
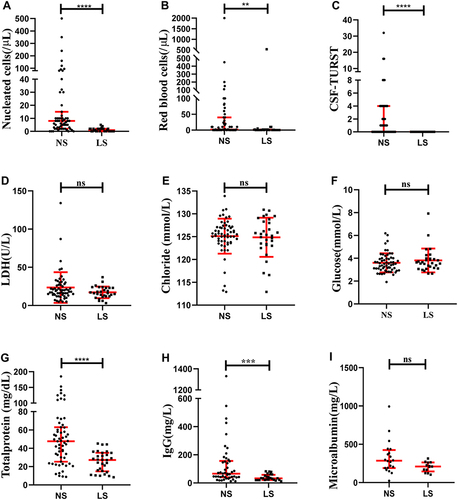
Figure 2 The serum markers of serum-TRUST (A), complement C3 (B), complement C4 (C), IgG (D), IgA (E), and IgM (F)from neurosyphilis and latent syphilis infection in the central nervous system are analyzed. The plasma detection results of PT (G), APTT (H), TT (I), Fib (J), and D-D (K) for the two groups are represented. The hematological index including lymphocyte, monocyte, neutrophil, eosinophil, and basophil for the two groups is shown (M). Comparison of biochemical indexes between the two groups (N and O). *, P<0.05; **, P <0.01; ***, P <0.001; ****, P <0.0001.
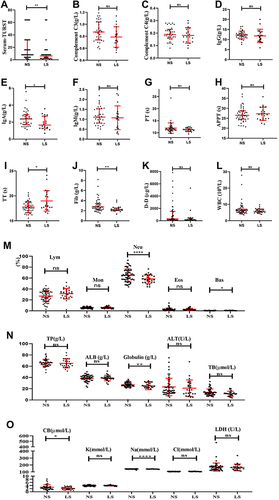
Figure 3 Heat map of correlation analysis between urine, serum, plasma, and peripheral blood test results and cerebrospinal fluid test results of neurosyphilis. *, P<0.05.
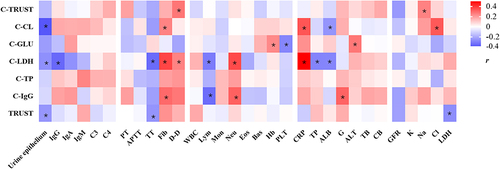
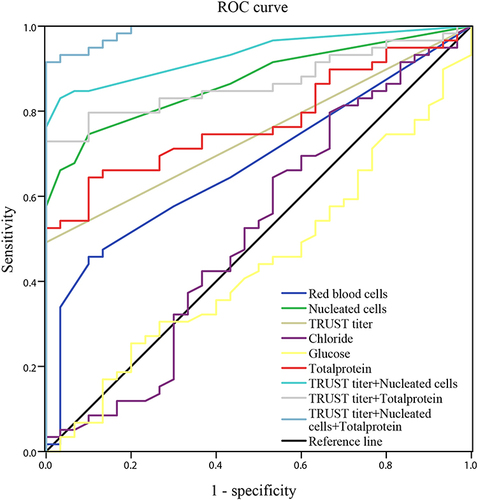
Table 2 Evaluation of Cerebrospinal Fluid Indexes of Neurosyphilis
Figure 4 ROC curve for neurosyphilis diagnosis indicators.