
Figures & data
Figure 1 Transcriptome sequencing analysis of ΔptrA and PAO1 strain. (A) The volcano plot of DEGs. (B) The KEGG pathway classification enrichment of DEGs. (C) STRING analysis of 290 downregulated and 87 upregulated DEGs; Lines represent reported or estimated protein-protein associations, and the nodes of genes involved in conducting similar functions are circled in black.
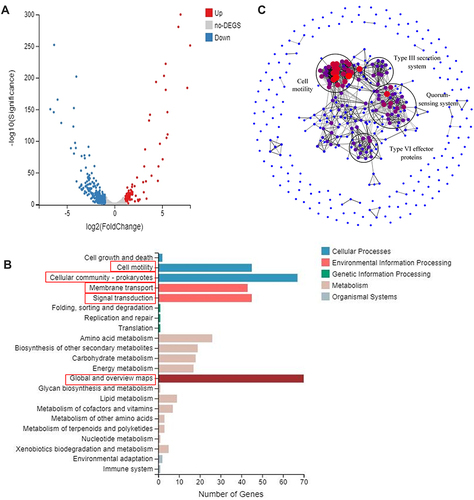
Figure 2 The relative quantitative analyses of T3SS, and QS-related genes. (A) The effect of PtrA on T3SS gene. (B) The effect of PtrA on QS gene. The gene expression level in WT strain was adjusted to 1.0 (presented as a dotted line). ns, not statistically significant, *P < 0.05, **P < 0.01, and***P < 0.001 analyzed via Student’s t-test. The results are expressed as mean ± SD, and the data represent a minimum of 3 individual experiments.
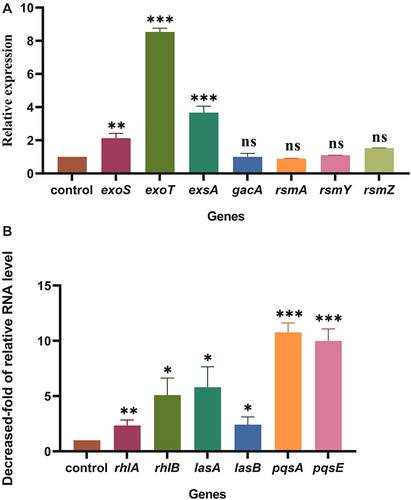
Figure 3 Effect of PtrA mutation on motility. ns, not statistically significant, *P < 0.05, **P < 0.01, and***P < 0.001 analyzed via Student’s t-test. The results are expressed as mean ± SD, and the data represent a minimum of 3 individual experiments.
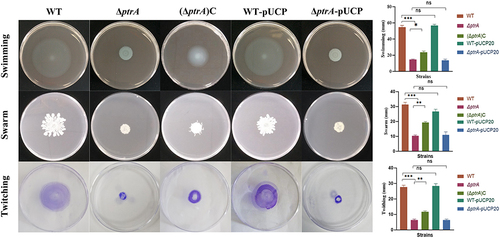
Figure 4 Effect of PtrA on QS-related extracellular virulence factor. (A and C) The determination of elastase production. (B and D) The determination of pyocyanin production. (E) The determination of rhamnolipid production. (F) The determination of proteolytic activity. ns, not statistically significant, *P < 0.05, **P < 0.01, and***P < 0.001 analyzed via Student’s t-test. The results are expressed as mean ± SD, and the data represent a minimum of 3 individual experiments.
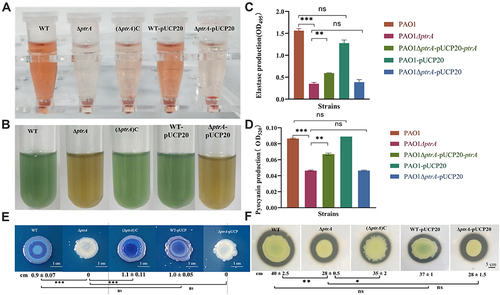
Figure 5 PtrA affected planktonic growth and biofilm formation. (A) Growth curve assay. (B and C) Biofilm formation assay. **P < 0.01, and ***P < 0.001 analyzed via Student’s t-test. The results are expressed as mean ± SD, and the data represent a minimum of 3 individual experiments.
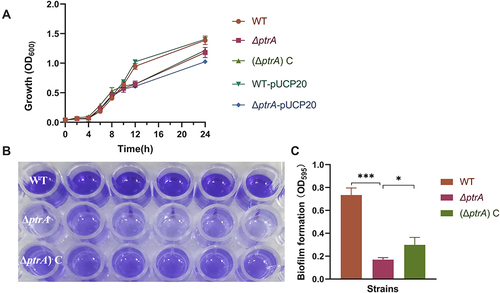
Figure 6 Analysis of the adherence and invasion ability of PA. (A) Adherence; (B) Invasion. ns, not statistically significant, *P < 0.05, and ***P < 0.001. The results are expressed as mean ± SD, and the data represent a minimum of 3 individual experiments.
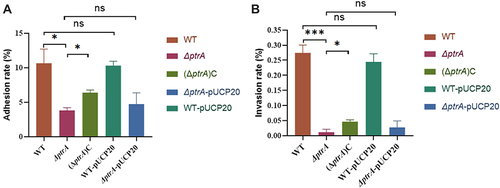
Figure 7 PtrA is crucial for PA virulence. (A) Cytotoxicity assay. (B) Galleria mellonella experiments. ns, not statistically significant, *P < 0.05, and**P < 0.01 via Student’s t-test. The results are expressed as mean ± SD, and the data represent a minimum of 3 individual experiments.
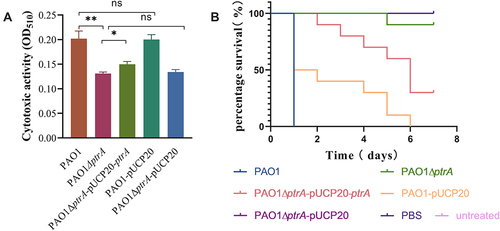
Table 1 The Minimum Inhibitory Concentration (MIC) of Common Antibiotics