
Figures & data
Table 1 Antibiotics and Their Respective Class for Which the Antibiotic Susceptibility Test Was Applied
Figure 1 Flow chart describing the study cohort and number of E.coli strains isolated from sample and included in the analysis, under study in rural Ujjain, India.
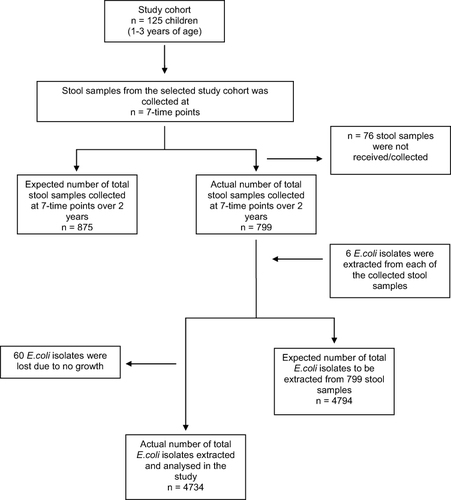
Table 2 Distribution of Antibiotic Consumption (DDD/100 Patient-Days) for Each of Antibiotic Class at 7-Time Points in Selected Cohort of Children (1–3 Years) During the Study Period
Figure 2 Overall cephalosporin consumption in the study cohort of children of 1–3 years of age at 7-time points, in defined daily doses (DDD) per 100 patient-days, in rural Ujjain, India.
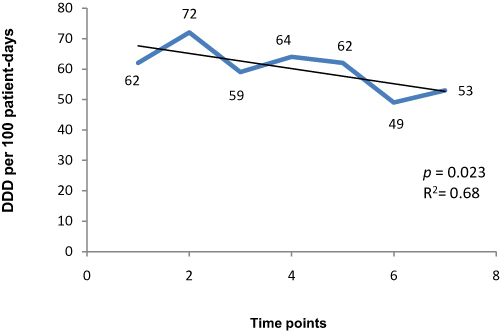
Table 3 Percentage Distribution of E.coli Isolates Resistant to the Selected Antibiotic Class at 7-Time Points
Table 4 Mixed-Effects Logistic Regression Analyses of the Relationship Between the Antibiotic Consumption and Resistance Among Selected Antibiotics in the E.coli isolates from 125 Children at 7-Time Points Over the Period of 2 Years