Figures & data
Figure 1 Flowchart of participant selection for the development of nomogram for prediction of unfavorable treatment outcome among MDR-TB patients, and reasons for exclusion, North West Ethiopia, September 2010 to July 2020.
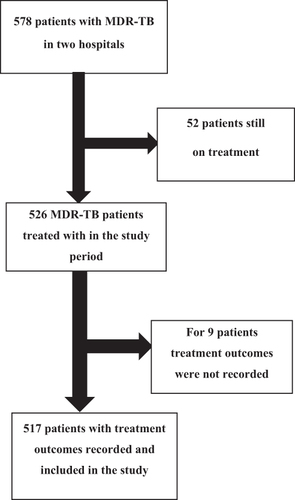
Table 1 Socio-Demographic and Behavioral Characteristics of MDR-TB Patients in North West Ethiopia, 2010 to 2020 (N = 517)
Table 2 Clinical Characteristics of MDR TB Patients in North West Ethiopia, 2010 to 2020 (N = 517)
Figure 2 Treatment outcomes among MDR-TB patients in North West Ethiopia, September 2010 to July 2020.
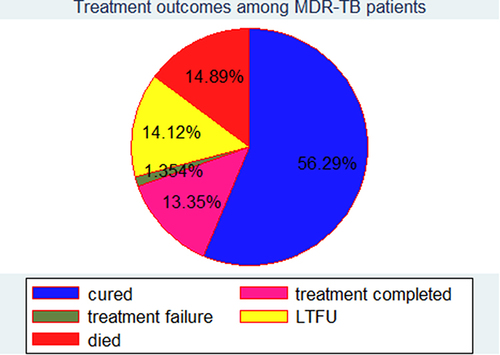
Table 3 Multivariable Logistic Regression Analysis and Model Reduction Using Potential Predictors of Unfavorable Treatment Outcome in Patients with Multidrug-Resistant Tuberculosis, in North West Ethiopia, 2010–2020 (N = 517)
Figure 3 Nomogram for the prediction of unfavorable treatment outcome among MDR-TB patients in North West Ethiopia, September 2010 to July 2020.
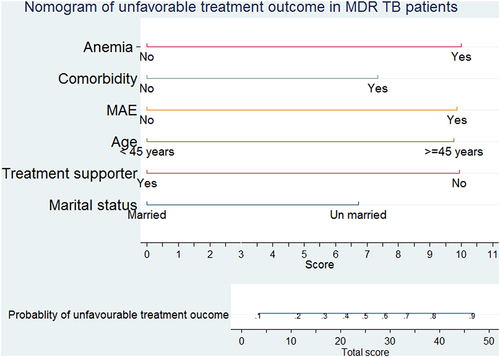
Figure 4 Observed versus predicted unfavorable treatment outcome probabilities in a sample.
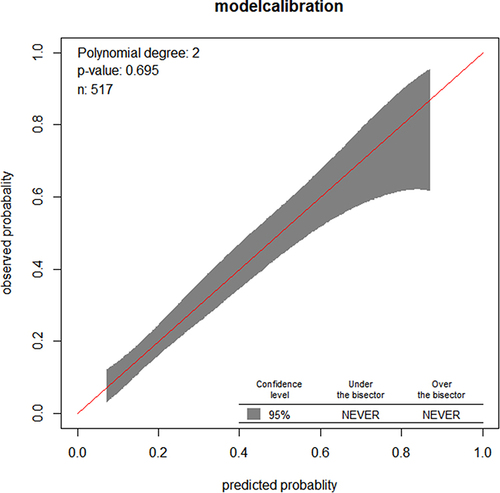
Table 4 Risk Classification of Unfavourable Treatment Outcome Using a Nomogram (n = 517)
Table 5 Sensitivity, Specificity, PPV, and NPV of the Nomogram for Several Cut-off Points
Figure 5 ROC curve of the model after internal validation using the bootstrapping method.
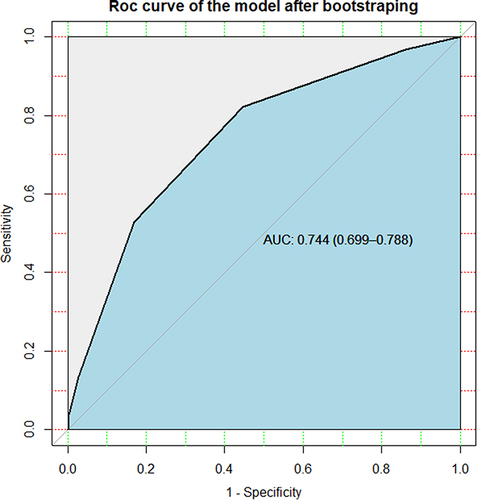
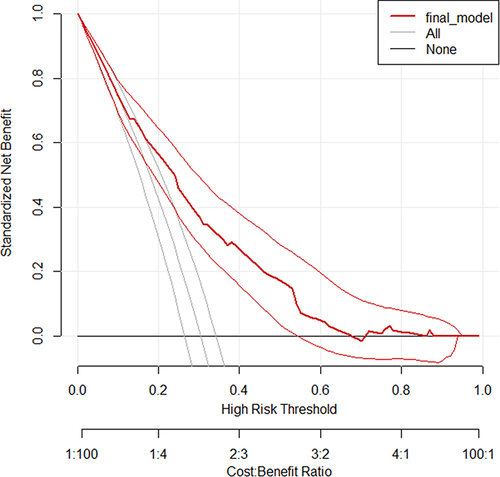
Figure 6 Decision curve plot showing the net benefit of the developed model for carrying out an intervention measure in MDR-TB patients at risk of unfavorable treatment outcome compared to all or none scenarios.