
Figures & data
Table 1 Different Combinations of Outer Membrane Proteins
Figure 1 Indirect ELISA analysis of serum samples. (A) Dot plot of human sera. (B) ROC analysis of human sera.
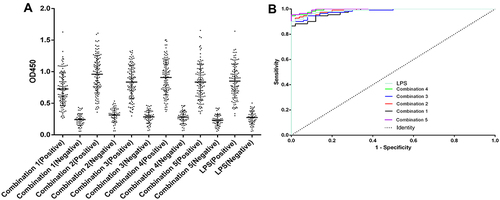
Figure 2 Indirect ELISA analysis of serum samples. (A) Dot plot of goat sera. (B) ROC analysis of goat sera.
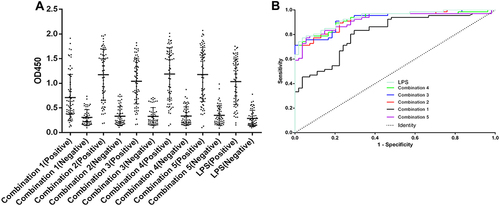
Table 2 Diagnostic Values of the Combinations Calculated for Different Cut-Off Values
Figure 3 Indirect ELISA analysis of serum samples. (A) Dot plot of cattle sera. (B) ROC analysis of cattle sera.
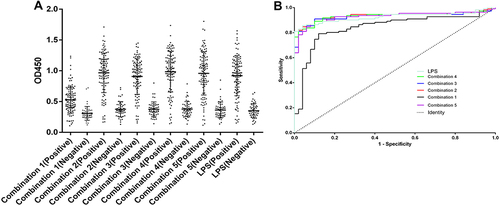
Table 3 Specificity Results the Combinations in the Indirect ELISA Diagnostic Method