
Figures & data
Table 1 Clinical and Demographical Characteristics of the Study Participants
Figure 1 miRNAs and mRNAs with no statistically significant differences in the expression levels in different groups. The horizontal line in the middle of the figure represents the median, and the horizontal lines at both ends are Q25 and Q75. (A–C) miRNAs with no statistically significant differences in the expression levels in different groups. (D) mRNAs with no statistically significant differences in the expression levels in different groups.
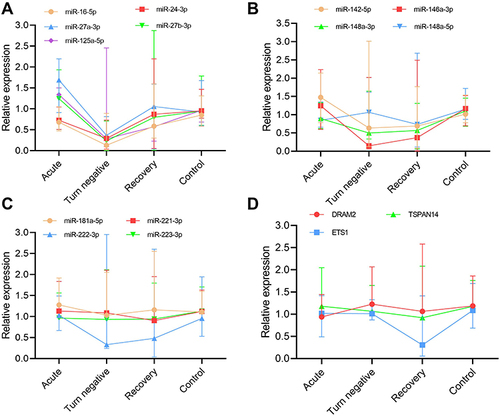
Figure 2 Comparison of miRNAs expression levels between patients with COVID-19 and healthy people at different stages. Three points on a line represent different periods of the same patient. *P < 0.05.
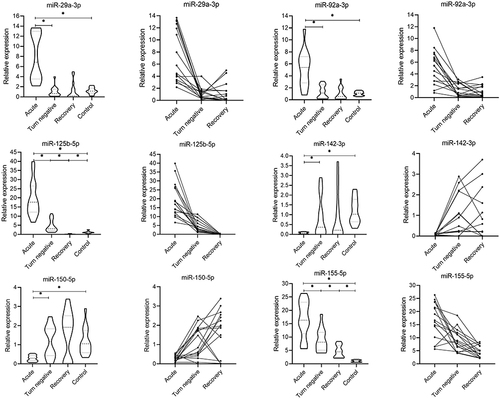
Figure 3 Comparison of mRNAs expression levels between patients with COVID-19 and healthy people at different stages. Three points on a line represent different periods of the same patient. *P < 0.05.
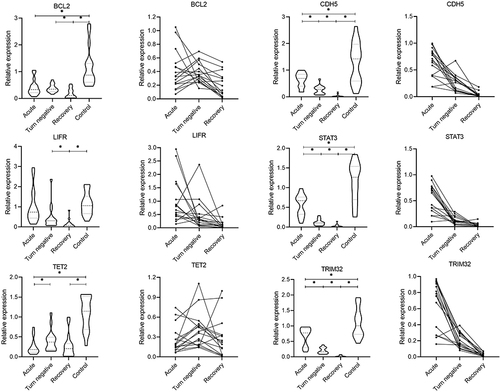
Figure 4 Correlations between differential expression miRNA-mRNA and laboratory parameters. *P < 0.05, **P < 0.01, -: Not analyzed.
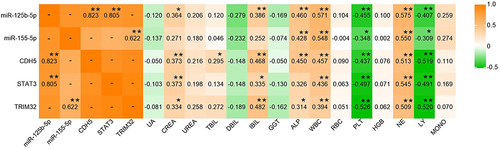
Table 2 Accuracy Evaluation of Classification Tree Model
Figure 5 Classification tree model and ROC curve analysis of independent variables in the model. (A) 0: control, 1: recovery, 2: turn negative, 3: acute; (B–D) ROC curves of miR-125b-5p, miR-155-5p, STAT3 and TRIM32 in identify and predict different stages of COVID-19.
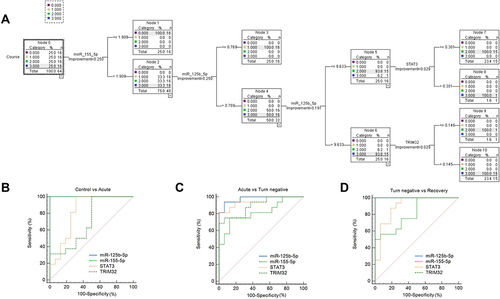
Table 3 ROC Curve Analysis of miR-125b-5p, miR-155-5p, STAT3 and TRIM32 in Predicting the Course of COVID-19