Figures & data
Table 1 Demographic Characteristics
Table 2 Parameter Estimates of Final Population Pharmacokinetic Model for Imipenem
Figure 1 GOF plots of final models showing observed versus population predicted concentration (A), observed vs individual predicted concentration (B).
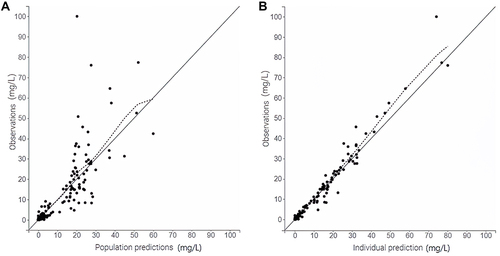
Figure 2 Scatter plot of the residuals: Individual weighted residuals (IWRES), seen on the left-hand side of the figure, versus time after dose (top) and concentration (bottom); Normalized Prediction Distribution Error (NDPE, 1000 replicates), seen on the right-hand side of the figure, versus time after dose (top) and concentration (bottom).
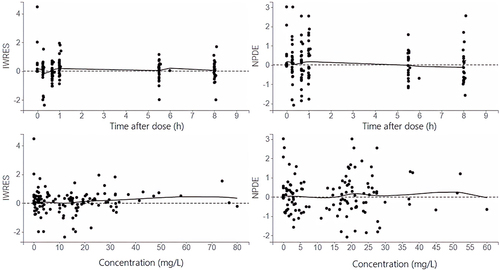
Figure 3 Visual Predictive Checks of observed imipenem concentrations (solid line) along with 10th, 50th and 90th percentiles overlaid on median (dashed line) and 90% prediction intervals (shaded region) of simulated concentrations generated from final model (1000 replicates).
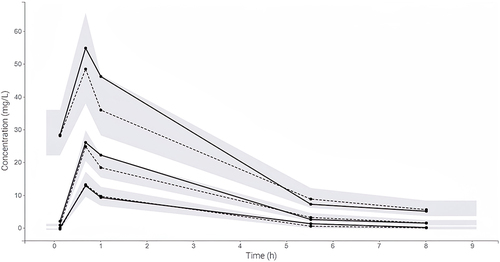
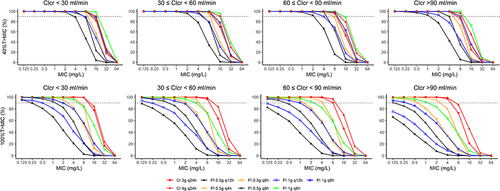
Figure 4 Probability of target attainment (PTA) of various imipenem dose regimens with a target of 40% (upper panels) and 100%T>MIC (lower panels), stratified based on patient renal function: <30, 30–60, 60–90, and >90 mL/min.