
Figures & data
Table 1 Demographics and Clinical Characteristics of Patients with Bloodstream Infections Secondary to Urinary Tract Infections
Figure 1 The flow diagram about the source of the study population.
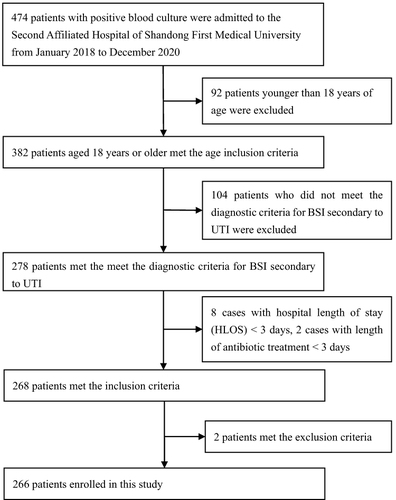
Table 2 Proportion of Different Pathogens in Blood Culture
Table 3 Multivariable Logistic Regression Model Results for Independent Risk Factors of Poor Prognosis
Table 4 Multivariable Logistic Regression Model Results for Independent Risk Factors of Death
Table 5 Area Under ROC Curves for the Prediction of Poor Prognosis
Table 6 Area Under ROC Curves for the Prediction of Death
Figure 2 Receiver operator characteristic (ROC) curves of the independent risk factors for the prediction of poor prognosis.
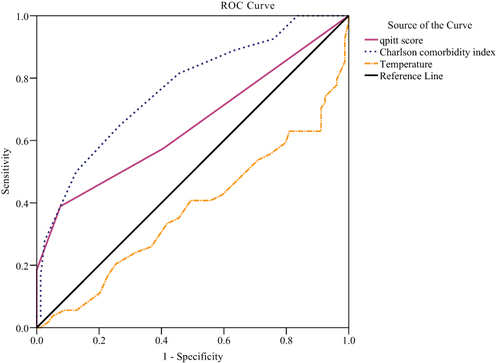
Figure 3 Receiver operator characteristic (ROC) curves of the independent risk factors for the prediction of death.
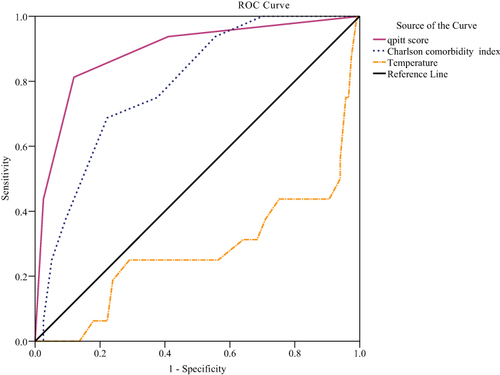
Table 7 Stratified Analysis of Carbapenems as the Initial Therapy on the Prognosis