Figures & data
Figure 1 (A) purified purple colonies of K. pneumoniae on Klebsiella selective agar. (B) Pink mucoid colonies of K. pneumoniae on MacConkey agar. (C) Identification of hypervirulent phenotype through string test. (D) Results of Antimicrobial Susceptibility testing (AST) by disk diffusion method.
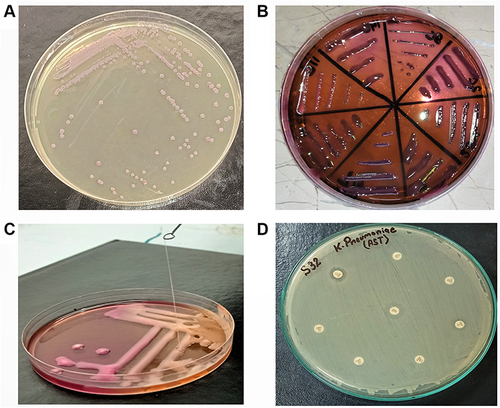
Table 1 Distribution of Virulence Genes and ARGs Among hvKp Isolates Along with the Details of the Primer Used in the Study
Table 2 Sample-Wise Distribution of Mcr-1 Harboring K. Pneumoniae (hvKp/Non-hvKp)
Figure 2 (A) Comparative analysis of resistance against different antibiotics maximum resistance in (Gray) against ampicillin. While least was against colistin shown in (Blue). (B) Determination of colistin resistance through rapid polymyxin NP test. (C) Detection of PCR product for mcr-1 gene through gel electrophoresis.
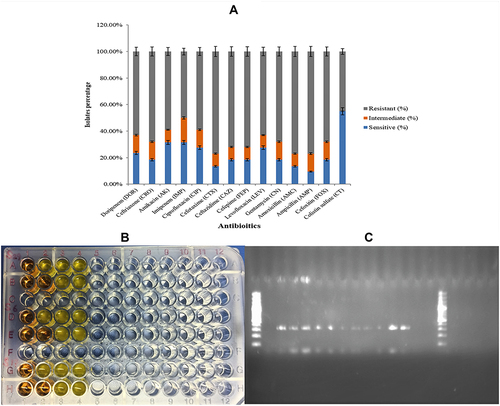
Table 3 Comparative Analysis of Colistin Resistance with PCR Results of Mcr-1 Gene, Spot Test, and hvKp Isolates
Figure 3 (A) Plaque assay after bacteriophage purification. (B) Detection of bacteriophages in wastewater sample through spot test. (C) Determination of host range by spot test. (D) TEM analysis of isolated bacteriophage shows icosahedral-isometric head with neck connected to a long, rigid and contractile tail as located in Myoviridae family. (E) Plaque Assay for Colistin resistant MDR hvKp isolates. (F) Comparative analysis of phage titer against colistin resistant MDR Klebsiella pneumoniae isolates.
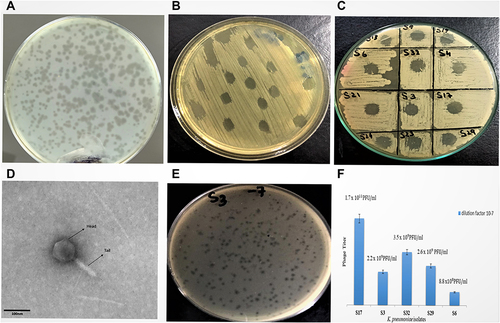
Figure 4 (A) Comparative analysis of phage titer at various ranges pH. (B) Comparative analysis of phage titer at various ranges temperatures. (C) Comparative analysis of phage titer at various concentrations of chloroform.
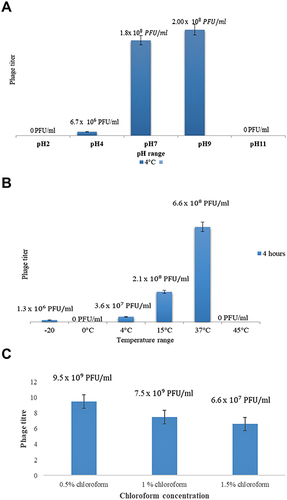
Figure 5 (A) Determination of one step growth curve through plaque assay. (B) Graphical analysis of phage titer at several time periods of one step growth curve.
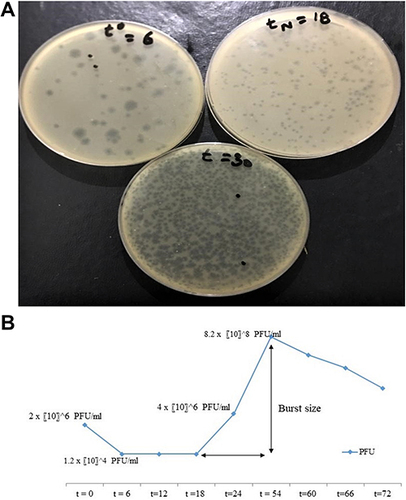
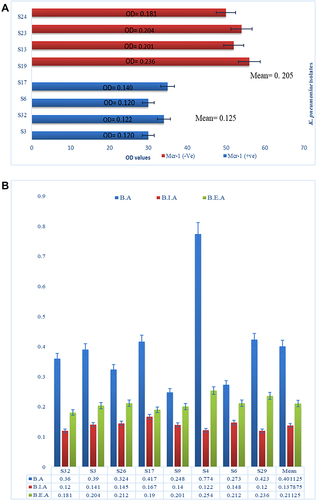
Figure 6 (A) Comparative analysis of bacteriophage susceptibility between mcr-1 negative (in red) and mcr-1 positive (in blue) isolates. (B) Biofilm assay (BA) in blue represents OD600 of biofilm assay. Biofilm inhibition assay (BIA) in red represents OD600 of Biofilm inhibition assay and biofilm eradication assay (BEA) in green represents OD600 of biofilm eradication assay. The comparative analysis of means at absolute right shows significance decrease in biofilm production.