
Figures & data
Table 1 Characteristics of Patients with Suspected Severe Pneumonia Included in the Study
Figure 1 Pathogen spectrum of mNGS results in patients with severe pneumonia (n = 53).
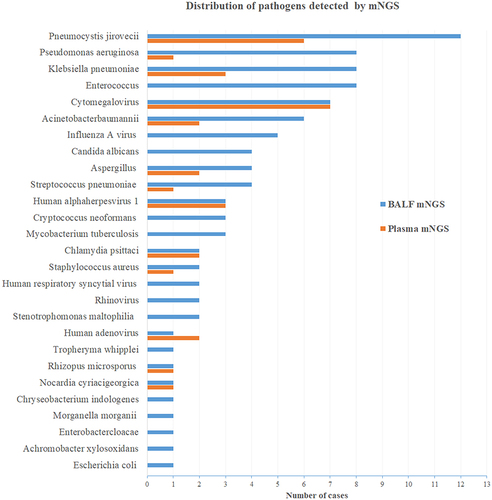
Figure 2 Diagnostic performance of mNGS in patients with severe pneumonia (n = 53). (A) Comparison of positive rates (P < 0.001) between BALF and plasma mNGS. (B) Different spectra of bacteria, fungi, and viruses were detected using BALF and plasma mNGS. No differences in the detected proportions of bacteria, fungi, and viruses were observed between BALF and plasma mNGS (P > 0.05). (C) Cases with various numbers of detected pathogens via mNGS. (D) Distribution of different types of pathogens in panel C. Outer circle, pathogens identified by BALF mNGS (n = 53); inner circle, pathogens identified by plasma mNGS (n = 22).
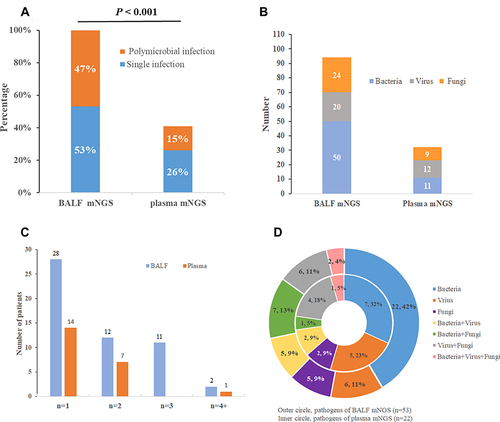
Table 2 Diagnostic Performance of mNGS and CMTs in Patients with Suspected Severe Pneumonia (n = 57)
Table 3 Impact of Microorganisms Detected Using Only Plasma mNGS in the Paired Sample (11 Cases)