Figures & data
Figure 1 Experimental design. Allow indicated days of incubation with or without trimethoprim/sulfamethoxazole.
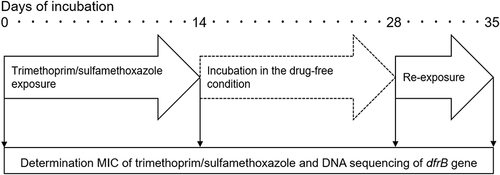
Table 1 MIC and DfrB Mutation Point in 18 Isolates of Trimethoprim/Sulfamethoxazole-Resistant S. aureus
Figure 2 MIC values of trimethoprim/sulfamethoxazole and accumulative percentage of resistant Staphylococcus aureus strain. The left vertical axis indicates MIC of trimethoprim/sulfamethoxazole. The dot pattern box indicates the MIC range (n=40), the open triangle indicates MIC50, and the open circle indicates MIC90 by the day. The right vertical axis indicates the cumulative resistance rate (solid line and open square).
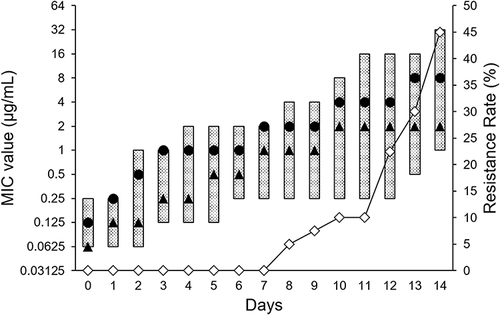
Figure 3 The comparison of the growth curve of Staphylococcus aureus strains. The vertical axis indicates the bacterial counts (log10CFU/mL) of parental strains that have acquired resistance (n=18) (open square) and parental strains that have not acquired resistance (n=22) (closed circle). *P <0.05.
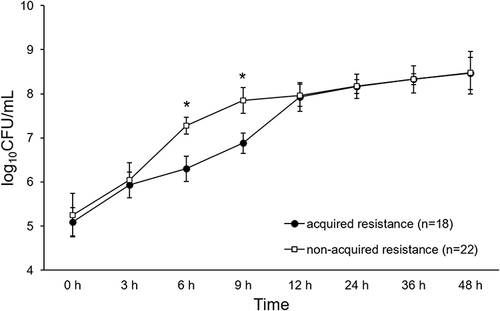
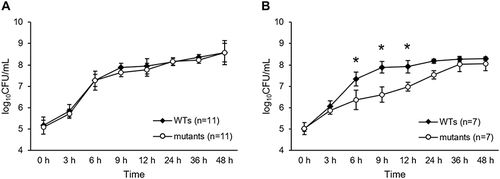
Figure 4 The change of the growth curve with the acquisition of SXT-resistance. The growth curve of Staphylococcus aureus strains that sustained resistance (n=11) (A) or that returned to susceptible (n=7) (B). The vertical axis indicates the optical density of wild type strains (WTs; closed square) and DfrB mutants (open circle). *P <0.05.