
Figures & data
Table 1 Primers for Analysis of Resistance Genes Used in This Study
Figure 1 Biofilm formation capabilities of different species of non-diphtheriae Corynebacterium isolates. **P<0.01 and ***P<0.001 vs the negative control.
Abbreviations: NEG, negative control; POS, positive control.
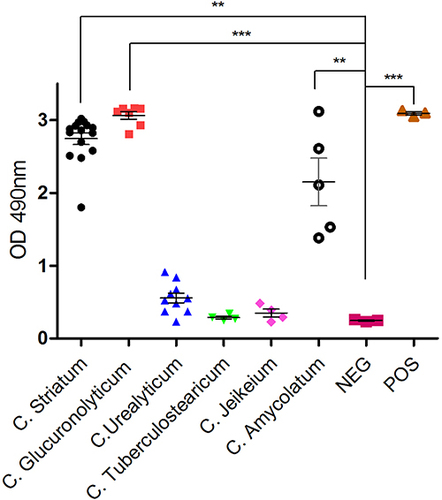
Table 2 Demographic and Clinical Characteristics of Non-Diphtheriae Corynebacterium Isolates
Table 3 Antimicrobial Susceptibilities of 45 Non-Diphtheriae Corynebacterium Against ten Antimicrobial Agents
Table 4 Drug-Resistant Gene Profiles of Non-Diphtheriae Corynebacterium Isolates
Table 5 Amino Acid Substitutions in gyrA Gene Associated with Resistance to Quinolones in the Non-Diphtheriae Corynebacterium Isolates