Figures & data
Table 1 Clinical Characteristics and Laboratory Data of 59 HSCT Recipients with K. pneumoniae Infections
Figure 1 Susceptibility of K. pneumoniae to clinically common antibiotics. (A) Drug resistance rates of K. pneumoniae to twelve antibiotics; (B) drug resistance rates of carbapenem-resistant Klebsiella pneumoniae to twelve antibiotics; (C) comparison of drug resistance rates of K. pneumoniae in two time periods (before 2018 vs after 2018).
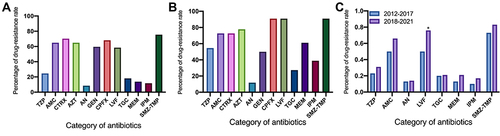
Table 2 Univariate and Multivariate Analysis of Risk Factors Associated with CRKP Acquisition Among HSCT Recipients
Table 3 Univariate and Multivariate Analysis of Risk Factors Associated with Mortality of K. pneumoniae Infection in HSCT Recipients
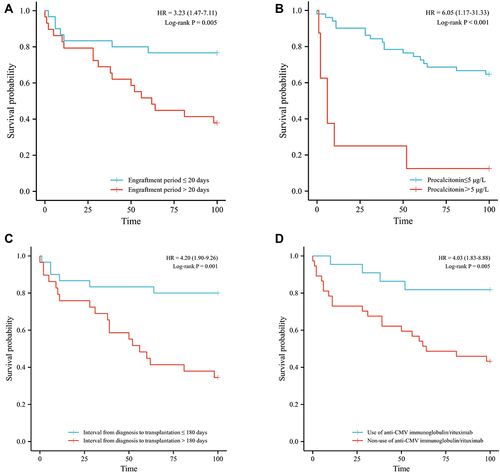
Figure 2 Survival comparison of patients with independent risk factors (Kaplan-Meier curve). (A) Engraftment period > 20 days vs ≤ 20 days (37.9% vs 76.7%, P=0.005); (B) procalcitonin > 5 μg/L vs ≤ 5 μg/L (12.5% vs 64.7%, P<0.001); (C) interval from diagnosis to transplantation > 180 days vs ≤ 180 days (34.5% vs 80.0% P=0.001) (D) non-use of anti-CMV immunoglobulin/rituximab vs use of (43.2% vs 81.8%, P=0.005).