
Figures & data
Table 1 Clinical Characteristics of the Patients with DTR vs Non-DTR Klebsiella pneumoniae
Figure 1 (A) Department distribution of the DTR-Kp-infected patients. (B) Sample type distribution of the DTR-Kp strains. (C) Resistance category distribution of all the enrolled Kp isolates.
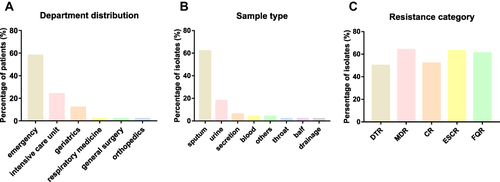
Figure 2 Percentage of the hypervirulent Klebsiella pneumoniae (hvKp) strains among the identified DTR-Kp strains from January 2020 to March 2021.
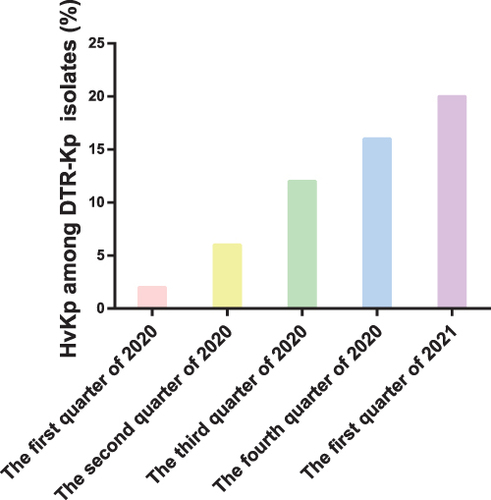
Figure 3 Genomic distribution of the DTR Klebsiella pneumoniae strains. Red: antimicrobial resistance genes. Blue: Virulence genes.
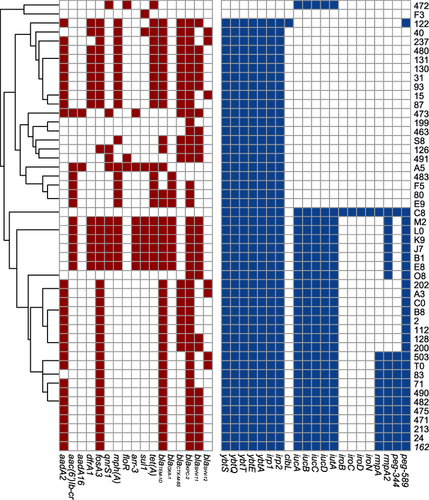
Figure 4 Kaplan–Meier curves for all-cause 30-day mortality. Statistical significance was determined by the Log rank test.
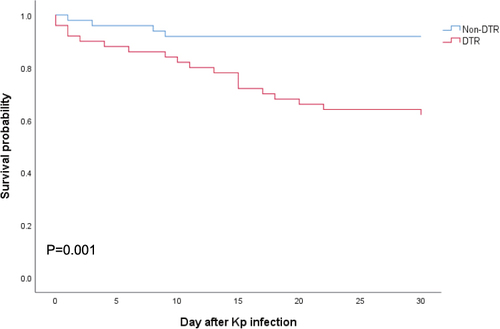
Table 2 Risk Factors for Death
Table 3 Risk Factors for DTR-Kp Infection