Figures & data
Figure 1 Validation of LBP protein screening in peripheral blood of normal human and STB patients.
Notes: (A) Differential protein clustering analysis graph. (B) Differential protein volcano distribution. (C) ELISA validation of differential protein LBP result analysis (***P < 0.001, the difference was statistically significant; Normal: healthy people). (D) ROC curve results of LBP in STB examination.
Abbreviations: FC, fold change; STB, spinal tuberculosis; LBP, lipopolysaccharide-binding protein; AUC, area under the curve.
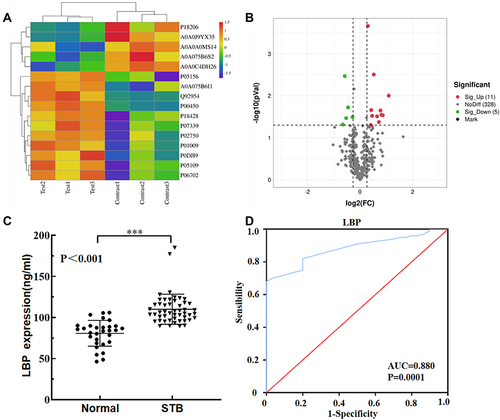
Table 1 Results of GO Functional Annotation Analyses
Table 2 Results of KEGG Signaling Pathway Analyses
Figure 2 Screening of LBP-related signalling pathways by KEEGG analysis.
Note: (A) LBP and TLRS-related signaling pathway, (B) LBP and NFκB-related signaling pathway.
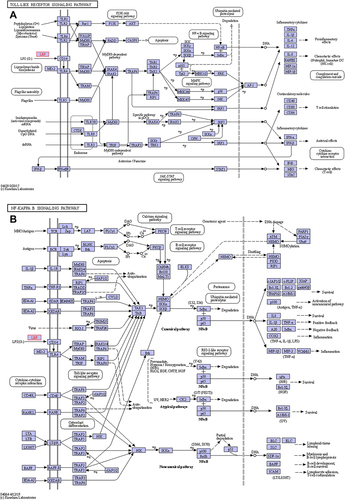
Table 3 General Statistics of Healthy Individuals and STB Patients
Table 4 Distribution of LBP Proteins in STB Clinical Phenotypes
Table 5 Analysis of Intra-Serum LBP Protein Levels and Clinical Phenotype in STB Patients
Figure 3 Analysis and detection results of LBP in peripheral blood of STB patients.
Note: (A–G) are curve regression analyses of CRP, ESR, disease duration, WBC, age, NEUT%, and LYM% values correlated with measured data of LBP expression levels in STB patients.
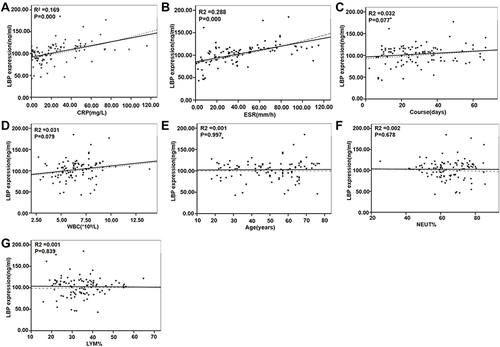
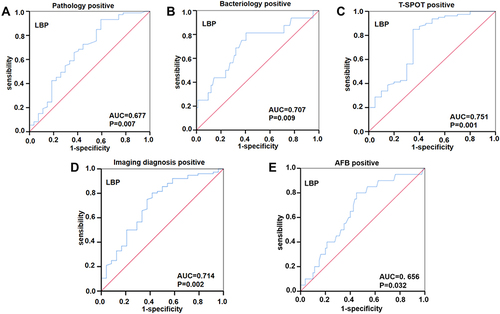
Figure 4 ROC analysis of molecular biomarkers of LBP in peripheral blood of STB patients.
Note: (A–E) are the ROC curve analysis of LBP combined with pathology, bacterial culture, T-SPOT, imaging, and antacid staining for diagnosis of STB.