Figures & data
Table 1 Demographics, Laboratory and Clinical Information of the Patients
Figure 1 Factors associated with mortality for critically ill patients. (A), RBP levels in serum sample from the patients with or without pneumonia. (B). RBP levels in serum sample from survived or non-survived cases. (C), RBP levels in serum sample from survived or non-survived cases in the patients with pneumonia. CURB-65 (D), GCS Scores (E), APACHE II (F), PCT level (G), lymphocyte ratio (H) and BUN level (I), which showed significant difference (P<0.05) between survived or non-survived cases with pneumonia. (*P<0.05, **P<0.01).
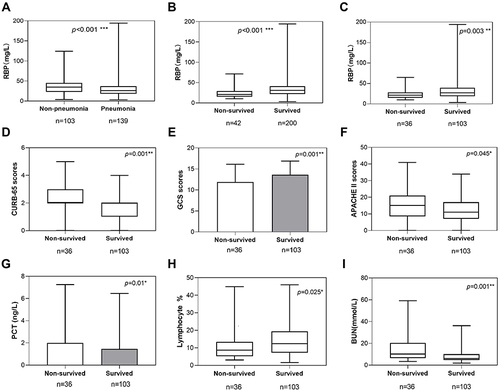
Table 2 Univariate and Multiple Logistic Regression Analyses to Identify the Individual Risk Factors for Critically Ill Patients with Pneumonia
Figure 2 Logistic LASSO regression for the prediction of in-hospital mortality. (A), LASSO coefficient profiles of the potential risk factors for pneumonia patients. 10-fold cross-validation was taken as the threshold value for parameter lambda selection. X axis represents the log of penalty coefficient lambda while Y axis represents the. (B), Confidence interval in every lambda of LASSO regression. X axis represents the log (λ) while Y axis represents the partial likelihood deviance (binomial deviance). Ten-fold cross-validation in the log (λ) sequence was used to plot the vertical dotted line at the value selected. The three risk factors were selected by the lambda at which the minimal deviance was achieved (minimum criteria and the 1-SE of the minimum criteria).
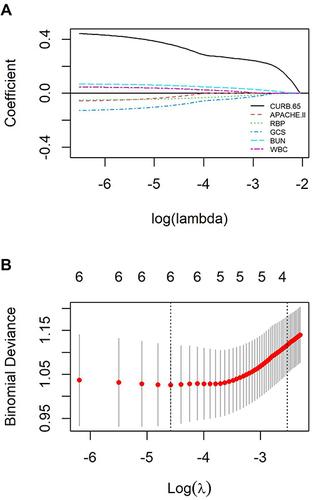
Table 3 Receiver Operating Characteristic (ROC) Curve Analyses Comparing the Diagnostic Power of New Parameters in Predicting In-Hospital Mortality for Critically Ill Patients with Pneumonia
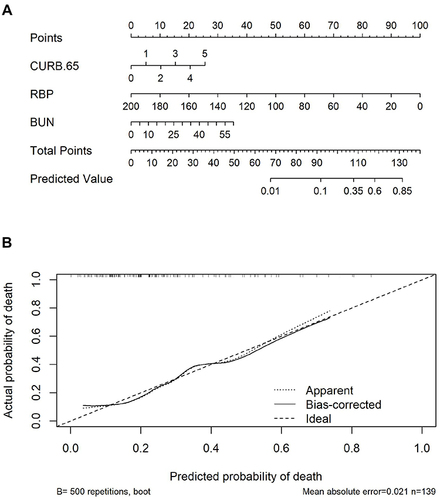
Figure 3 Nomogram Analysis for the prediction of the unfavorable outcome. (A) A nomogram chart for the prediction of in-hospital mortality within pneumonia patients. (B) The corresponding calibration curves of the nomogram above. A dashed line is a reference line where an ideal nomogram should lie.