Figures & data
Table 1 Demographic and Clinical Characteristics of Study Participants
Figure 1 Correlation analysis between the inflammatory parameters and fasting blood sugar in the whole population (n =991).
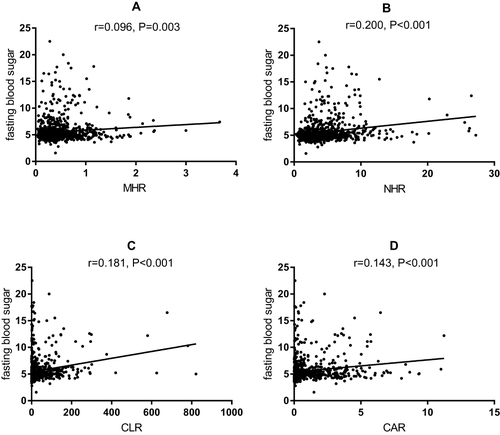
Figure 2 Correlation analysis between the inflammatory parameters and fasting blood sugar in the APTB-T2DM patients (n =991).
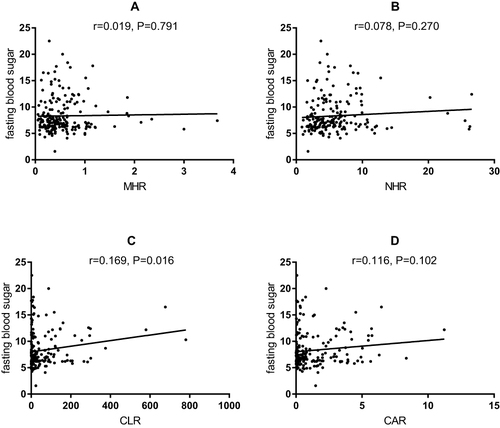
Figure 3 Receiver operating characteristic (ROC) curve analysis of the inflammatory parameters. The area under the ROC curve (AUC) values in the MHR, NHR, CLR, and CAR were 0.632(95%confidence interval: 0.542–0.632), 0.72(95% confidence interval: 0.639–0.720), 0.715(95%confidence interval: 0.637–0.715), and 0.713 (95%confidence interval: 0.636–0.713), respectively.
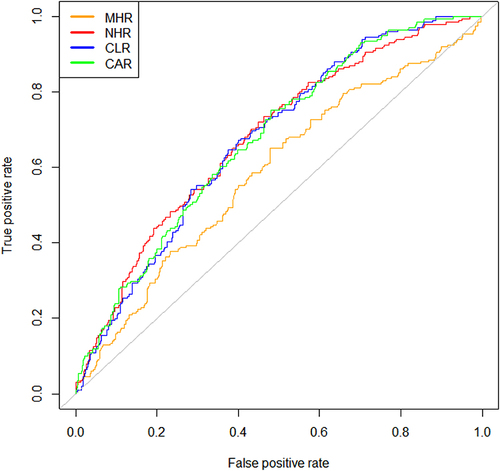
Figure 4 The univariate logistic regression analyses for APTB-T2DM patients.
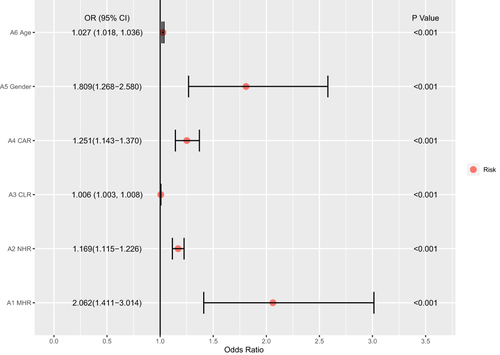
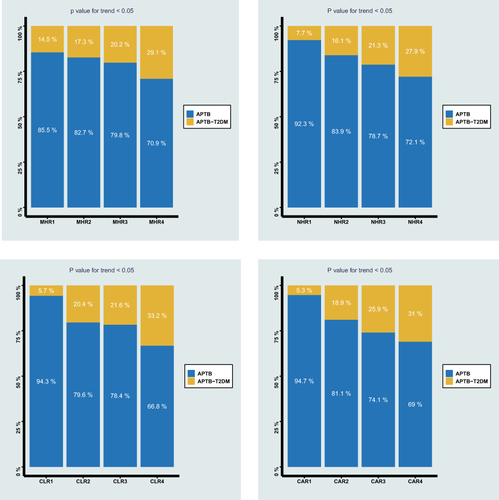
Figure 5 The prevalence of APTB-T2DM patients among different quartiles of monocyte to MHR, NHR, CLR, and CAR.