
Figures & data
Table 1 Demographic Characteristics of Patients with Maxillofacial Space Infection (n = 746)
Table 2 Analytical Results for Different Regions (n = 746)
Table 3 Analytical Results for Different Ethnic Groups (n = 746)
Figure 1 Proportions of etiologic conditions for maxillofacial space infections.
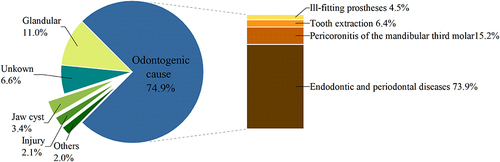
Figure 2 Comparison of the distribution of the identified spaces between multiple space infections and single space infections.
Abbreviations: SMS, submandibular space; M, masseteric space; SM, submental space; B, buccal space; PM, pterygomandibular space; PP, parapharyngeal space; SL, sublingual space; T, temporal space; C, cervical space; IT, infratemporal space; IO, infraorbital space; P, parotid space; Me, mediastinum.
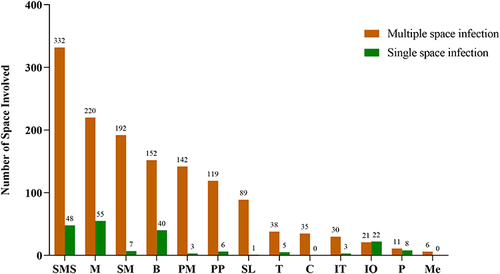
Figure 3 Proportional distribution of microorganisms from 488 patients with positive pathogen identification.
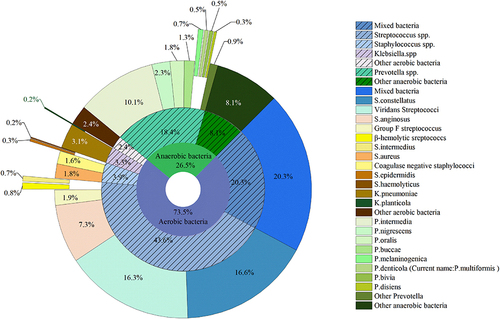
Figure 4 Antibiotic resistance characteristics of main aerobia.
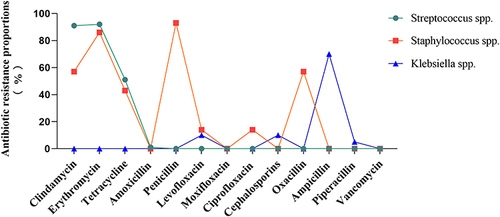
Table 4 Results of Univariate Analysis (n = 427)
Table 5 Results of Multivariable Binary Logistic Regression Analysis (n = 427)