
Figures & data
Table 1 Normality Test in 147 Subjects
Figure 1 Flow of Patients Through the Ascorbic Acid, Thiamine and Combination of Them in Septic Patients.
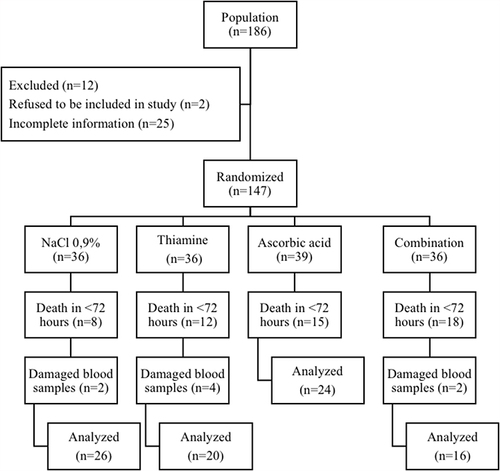
Table 2 Baseline Characteristics of the Study Population
Figure 2 Kaplan Meier survival curve in non-survival subjects within 72 hours of observation.
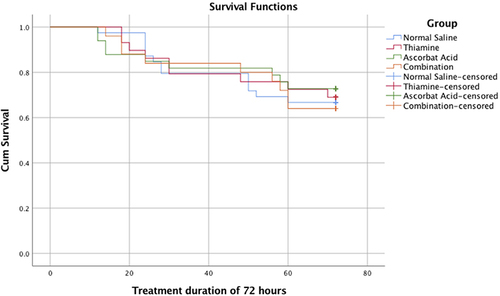
Figure 3 Scatterplot graph of MMP-9 and TIMP-1 levels in sepsis patients who did not survive during observation.
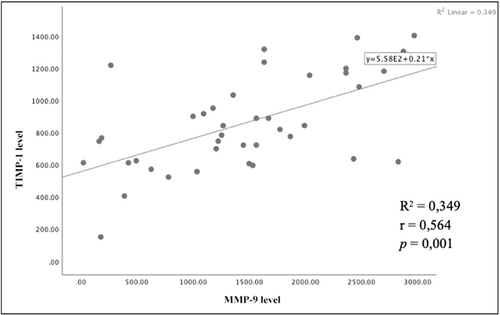
Figure 4 Scatterplot graph of MMP-9, TIMP-1 levels, and MMP-9/TIMP-1 ratio in sepsis patients who did not survive during observation.
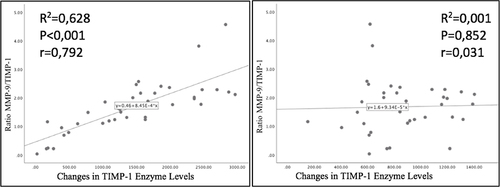
Figure 5 Scatterplot graph of changes in MMP-9, TIMP-1 level, and MMP-9/TIMP-1 ratio in sepsis patients who survived during observation.
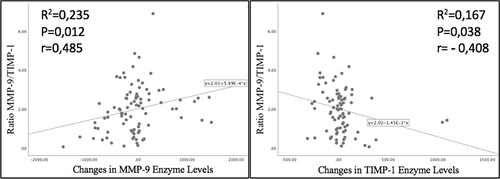
Table 3 Comparison of MMP-9 Level in 3 Groups
Table 4 Comparison of TIMP-1 Level in 3 Groups
Table 5 Linear Regression Analysis Between the Balance of MMP-9/TIMP-1 with Levels of MMP-9 and TIMP-1 in Sepsis Patients