
Figures & data
Table 1 Demographics and Clinical Characteristics of the Patients with Candidaemia
Figure 1 The incidence of Candida BSI from 2016 to 2021. The figure showed the change in the crude incidence of Candida BSI and the incidence rate of two major types of candidaemia through the time-course study. The crude incidence rate was calculated by the number of candidaemia cases per 1000 admissions between 2016 and 2021 in Hefei, Anhui. Overall, an increasing trend of incidence rate in candidaemia through the years was seen. Particularly, the incidence of Candida tropicalis BSI was always higher than that of Candida albicans BSI, except in 2018 and 2019.
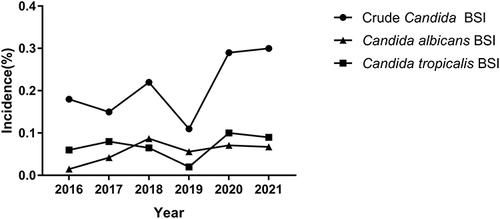
Table 2 Azole Resistance Among Candida Isolates from 2016–2021
Figure 2 Trends in the species distribution of candidaemia from 2016 to 2021. The figure showed the change in the species distribution of candidaemia between 2016 and 2021. Candida tropicalis BSI always ranked at the top except in 2018 and 2019. The most prevalent species was Candida tropicalis (38/115, 33.0%), followed by Candida albicans (32/115, 27.8%), Candida parapsilosis complex (22/115, 19.1%), Candida glabrata (17/115, 14.8%), Candida krusei (4/115, 3.5%) and others Candida spp. (2/115, 1.8%). Candida non-albicans species comprised more than half of the isolates, mainly attributed to Candida tropicalis accounting for 45% of the non-albicans isolates.
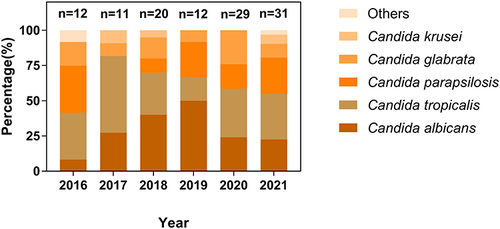
Table 3 Comparison Between Candida tropicalis BSI and Candida non-tropicalis BSI
Table 4 Comparison Between Candida albicans BSI and Candida non-albicans BSI
Table 5 Comparison Between Candida parapsilosis BSI and Candida non-parapsilosis BSI
Table 6 Logistic Regression Analysis of Risk Factors Associated with 30-Day Crude Mortality in Patients with Candidaemia