Figures & data
Figure 1 Flow chart of the study.
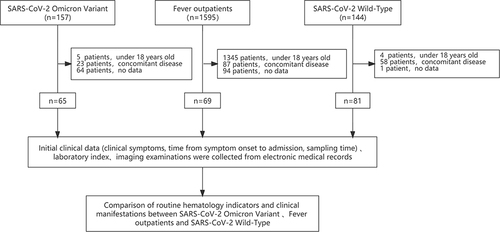
Table 1 Baseline Characteristics of the Patients
Figure 2 Clinical symptoms, time of patients progression. (A) Omicron group; (B) Fever group; (C) Wild-Type group.
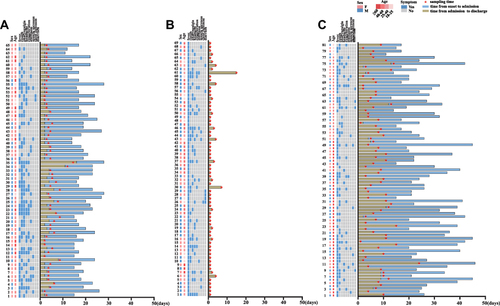
Figure 3 Comparison of initial indexes of peripheral blood cell indices and CRP of Omicron, Fever and Wild-Type. The count of white blood cell, neutrophil, lymphocyte, monocyte, eosinophil between and CRP of Omicron, Fever and Wild-Type group were 5.0 (3.6–6.1) vs 10.1 (7.6–12.9) vs 5.4 (4.3–6.4)×109/L, 2.6 (1.8–3.9) vs 8.1 (5.9–10.9) vs 3.4 (2.5–4.7)×109/L, 1.3 (1.1–1.9) vs 1.4 (0.9–1.8) vs 1.3 (0.9–1.5)×109/L, 0.5 (0.4–0.7) vs 0.6 (0.4–0.9) vs 0.4 (0.3–0.6)×109/L, 0.06 (0.02–0.13) vs 0.05 (0.02–0.11) vs 0.01 (0.00–0.04)×109/L, 7.8 (4.3–16.3) vs 12.9 (5.0–37.9) vs 9.9 (3.8–21.5) mg/L.
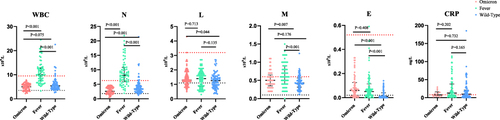
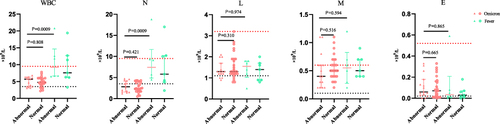
Figure 4 Comparison of initial peripheral blood cell indices between Omicron and Fever in different symptom. (A) The patient presents with fever, The count of white blood cell, neutrophil, lymphocyte, monocyte and eosinophil of Omicron group were 5.0 (3.8–6.0) vs 5.0 (3.5–6.3) ×109/L; 2.9 (1.9–3.9) vs 2.5 (1.6–4.1).×109/L; 1.3 (1.0–1.6) vs 1.5 (1.2–1.9)×109/L; 0.5 (0.4–0.7) vs 0.4 (0.3–0.6)×109/L; 0.05 (0.01–0.09) vs 0.07 (0.04–0.15)×109/L. (B) The patient presents with cough, The count of white blood cell, neutrophil, lymphocyte, monocyte and eosinophil of Omicron group were 4.7 (3.4–6.0) vs 5.6 (4.3–6.1).×109/L; 2.4 (1.8–3.9) vs 3.4 (1.9–4.0)×109/L; 1.3 (1.2–1.8) vs 1.4(0.9–1.9)×109/L; 0.4 (0.3–0.6) vs: 0.6(0.4–0.8)×109/L; 0.4 (0.3–0.6) vs 0.6(0.4–0.8)×109/L. (C) The patient presents with pharyngalgia, The count of white blood cell, neutrophil, lymphocyte, monocyte and eosinophil of Omicron group were 4.6 (3.4–5.7) vs 5.6 (4.1–6.4).×109/L; 2.4 (1.7–3.8) vs 3.5 (1.9–4.1)×109/L; 1.3 (1.2–1.9) vs 1.3(1.0–1.7)×109/L; 0.4 (0.3–0.6) vs 0.6 (0.4–0.7)×109/L, 0.07 (0.03–0.13) vs 0.06 (0.01–0.15)×109/L. (D): The patient presents with headache, The count of white blood cell, neutrophil, lymphocyte, monocyte and eosinophil of Omicron group were 4.4 (3.5–5.8) vs 5.4 (4.0–6.3) ×109/L; 2.6 (1.8–3.7) vs 2.7 (1.8–4.0)×109/L; 1.2 (0.9–1.3) vs 1.4 (1.2–1.9)×109/L; 0.5 (0.4–0.6) vs 0.5 (0.3–0.7)×109/L; 0.02 (0.01–0.06) vs 0.08 (0.05–0.14)×109/L. (E) The patient presents with expectoration, The count of white blood cell, neutrophil, lymphocyte, monocyte and eosinophil of Omicron group were 4.6 (3.4–5.6) vs 5.4 (3.9–6.3)×109/L; 2.4 (1.7–3.9) vs 2.8 (1.9–4.0)×109/L; 1.3 (1.2–1.7) vs 1.3 (1.0–1.9)×109/L; 0.4 (0.4–0.6) vs 0.5 (0.3–0.7)×109/L; 0.05 (0.03–0.08) vs 0.07 (0.02–0.15)×109/L.
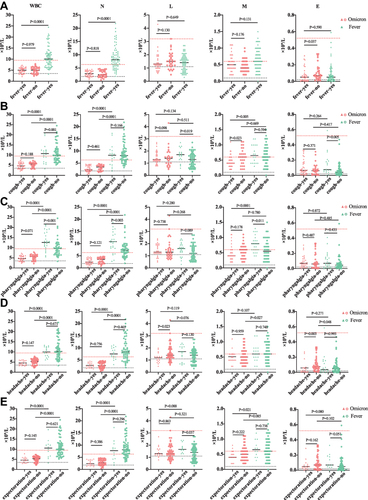
Figure 5 Comparison of the peripheral blood cell indices in of Omicron patients and Fever with variant Lung imaging. The count of white blood cell, neutrophil, lymphocyte, monocyte and Eosinophil of Omicron patients with opposite Lung imaging were 5.7 (3.5–6.3) vs 4.8 (3.8–6.0)×109/L; 3.0 (1.6–4.2) vs 2.4 (1.7–3.9) ×109/L; 1.3 (1.2–1.7) vs 1.3 (1.2–1.9)×109/L; 0.4 (0.2–0.6) vs 0.5 (30.4–0.7)×109/L; 0.06 (0.03–0.18) vs 0.07 (0.01–0.16)×109/L.