
Figures & data
Table 1 List of Primers Used for qPCR Analysis
Figure 1 Growth and biofilm formation of BP-AB assessed by curve analysis.
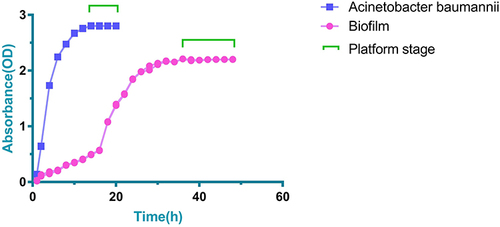
Figure 2 Inhibitory curve with various concentrations of myrtenol treatment on biofilm formation of BP-AB.
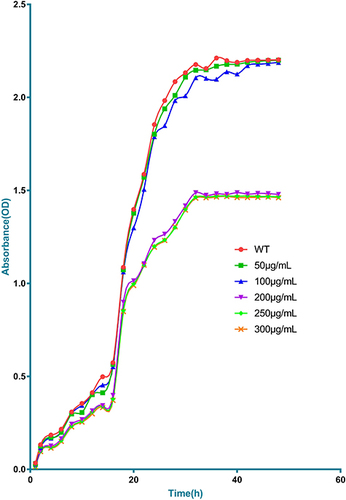
Figure 3 Antibiofilm efficacy comparison with various concentrations of myrtenol treatment on biofilm formation of BP-AB.
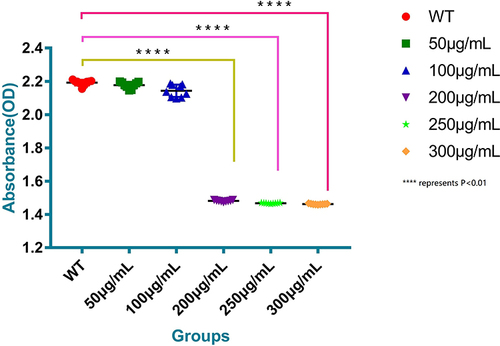
Figure 4 (A)Effect of various concentrations of myrtenol treatment on BP-AB biofilm formation on glass test tubes. (B) Microscopic images representing the antibiofilm efficacy with various concentrations of myrtenol treatment against BP-AB. (C) CLSM images representing the antibiofilm efficacy with various concentrations of myrtenol treatment against BP-AB. (D) SEM images representing the antibiofilm efficacy with various concentrations of myrtenol treatment against BP-AB.
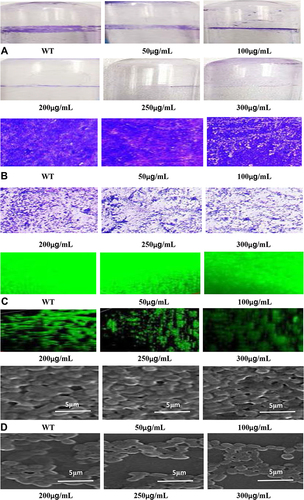
Figure 5 Comstat analysis of biofilms formed by BP-AB strains with various concentrations of myrtenol treatment.
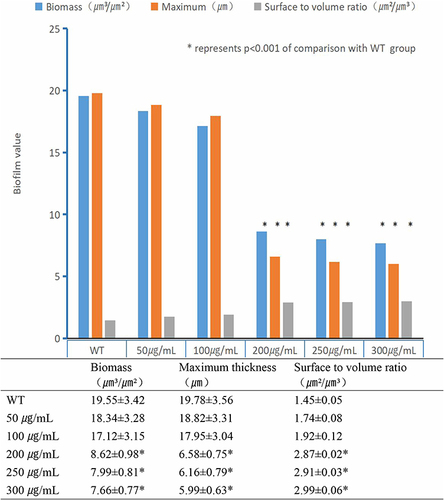
Figure 6 Effect of various concentrations of myrtenol treatment on expression profile of genes involved in biofilm formation in BP-AB.
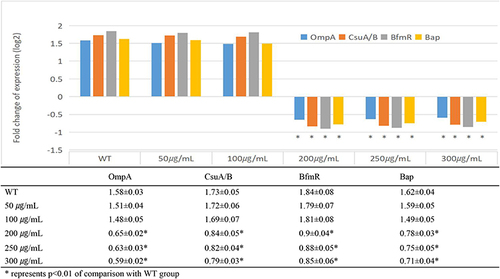
Figure 7 A schematic diagram representing the effect of myrtenol treatment on biofilm associated genes expression in BP-AB.
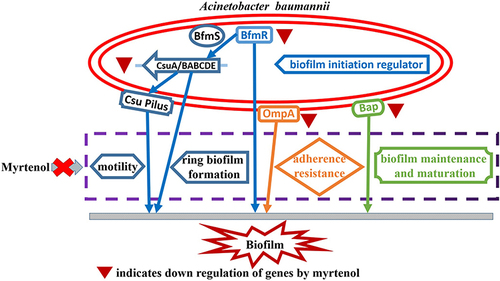
Table 2 Antibiotic MIC Values of blaNDM-1-Producing Acinetobacter Baumannii Strains in the Absence and Presence of Myrtenol