
Figures & data
Table 1 Patient Characteristics
Figure 1 Study flow chart.
Abbreviations: COVID-19, coronavirus disease 2019; ICD-10, The International Classification of Diseases 10th Revision; n, number of patients.
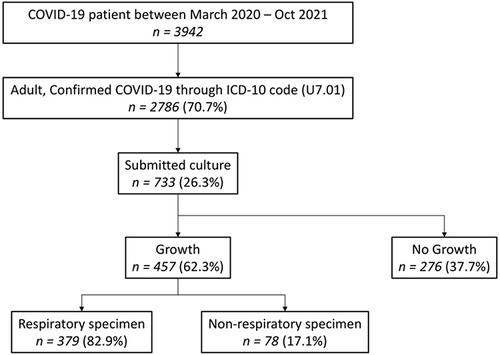
Figure 2 Distribution of identified pathogens from respiratory and non-respiratory specimen. X-axis shows the actual number of isolates identified and Y-axis shows the name of identified isolate, stratified by Gram-type bacteria.
Abbreviations: GNB, Gram-negative bacteria; GPB, Gram-positive bacteria.
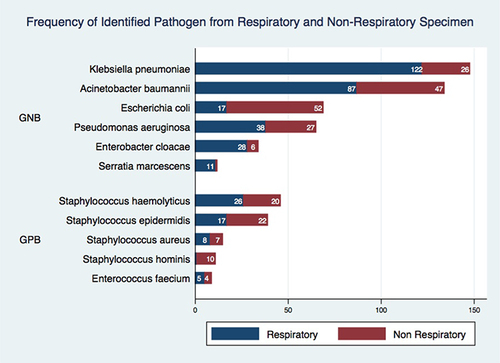
Table 2 Percentage Resistance of Gram-Negative Bacteria to Selected Antibiotics from Respiratory and Non-Respiratory Specimen
Table 3 Percentage Resistance of Gram-Positive Bacteria to Selected Antibiotics from Respiratory and Non-Respiratory Specimen