Figures & data
Figure 1 The flow diagram of the patients’ enrollment.
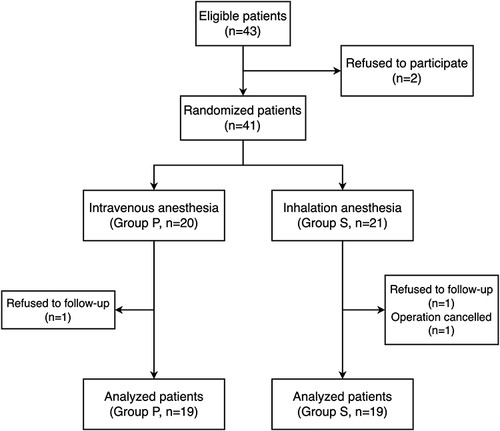
Table 1 Basic Information and Perioperative Clinical Outcomes of the Two Groups
Figure 2 Changes of HBV-DNA levels in the two groups. Data were presented as box with whiskers, median values are shown by the horizontal line inside the box, interquartile range (IQR) by the top and bottom of the boxes, and values were outside the 5th and 95th percentiles by dots and squares. *P < 0.05 vs the Tbaseline in Group P; **P < 0.05 vs the Tbaseline in Group S.
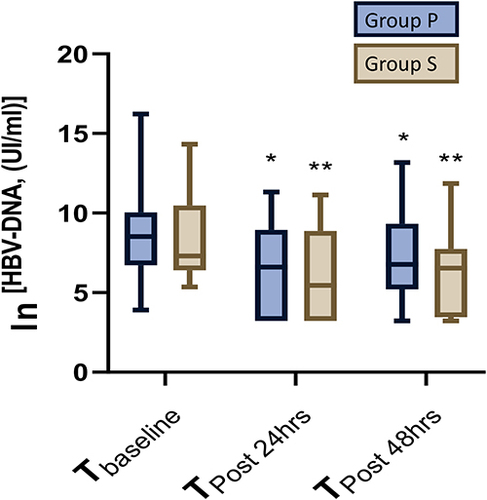
Figure 3 Comparison of TBNK levels in the two groups. (A) CD4+ T cell %; (B) CD4+ T/ CD8+ T; (C) Total B cell %; (D) NK cell %; (E) CD8+ T cell %; (F) Total T cell %. Data were presented as box with whiskers, median values are shown by the horizontal line inside the box, interquartile range (IQR) by the top and bottom of the boxes, and values were outside the 5th and 95th percentiles by dots and squares. *P < 0.05 vs the Tbaseline in Group P; **P < 0.05 vs the Tbaseline in Group S; #P < 0.05 vs the Tpost 24hrs in Group P; ##P < 0.05 vs the Tpost 24hrs in Group S.
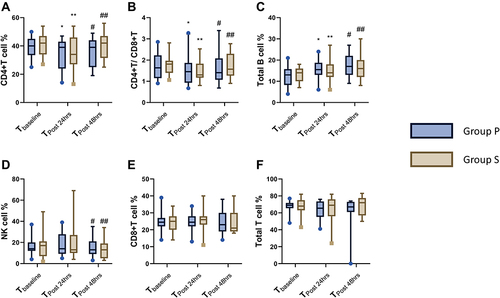
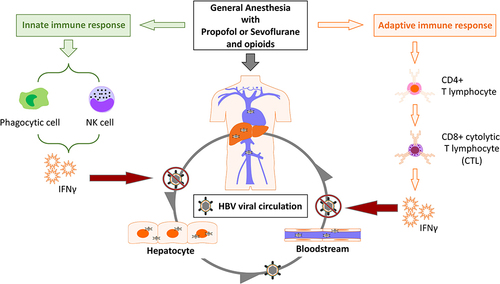
Figure 4 The putative mechanism transiently enhanced the immune clearance of HBV after general anesthesia. Grey arrows indicate the circulation of hepatitis B virus (HBV) and its virions containing relaxed circular DNA (rcDNA) in hepatocytes and bloodstream; Orange arrows indicate the activation of adaptive immune function by general anesthesia leading to the production of interferon gamma (INF-γ); Green arrows indicate the activation of innate immune function by general anesthesia leading to the production of interferon gamma (INF-γ); Red arrows indicate inhibition of HBV circulation by interferon-gamma (INF-γ).