Figures & data
Table 1 The Sequences of the Primers and Probes Used in ddPCR
Figure 1 Evaluation of the HHV-6B probe primer set using plasmid standards. (A) Dilution curve of plasmid standard quantification by ddPCR. The correlation between the expected and observed copy numbers is shown. Each black dot represents a single replicate well of the dilution experiment, while the regression line is based on the average concentration at each dilution. (B) The lower detection limit of droplet digital PCR. The results are presented as the means ±1 SD.
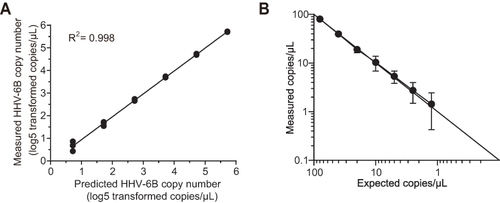
Table 2 Characteristics of Infection in Patients with HHV-6B
Figure 2 Comparison between ddPCR and mNGS for HHV-6B detection. (A) Scatter plot and correlation of ddPCR and mNGS results in HHV-6B detection. (B) Comparison of ddPCR and mNGS results for HHV-6B detection. The blue bar shows that both ddPCR and mNGS detected HHV-6B positivity; the burgundy bar shows that ddPCR detected HHV-6B positivity, while mNGS results were negative; the gray bar indicates that neither ddPCR nor mNGS detected HHV-6B virus.
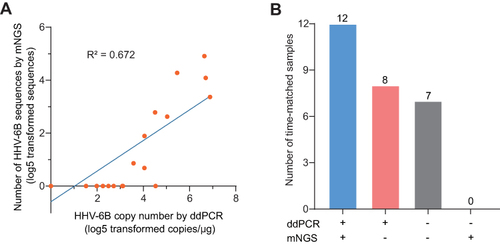
Table 3 Clinical Characteristics of Patients Treated with CAR T for Continuous HHV-6B Monitoring
Figure 3 Time of onset and levels of HHV-6B after CAR T-cell therapy. (A) Time of onset of HHV-6B and CRS in 10 patients after CAR T-cell infusion. Red dots represent the onset of HHV-6B infection; blue dots indicate the end of HHV-6B infection; black dots represent HHV-6B levels that were greatly reduced but that did not drop to 0; green solid lines indicate ranges of CRS (days); black dotted lines indicate ranges of HHV-6B infection (days). (B) HHV-6B copy number levels after CAR T-cell therapy. Arrows represent the first mNGS monitoring time point after CAR T-cell infusion; red dots/red solid lines indicate HHV-6B detection in a peripheral blood sample; dark green dots/dark green solid lines represent HHV-6B detection in a urine specimen; black dots represent antiviral therapy. A-J each represent a lymphoma patient treated with CAR T-cell therapy.
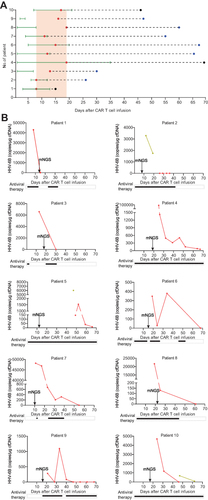
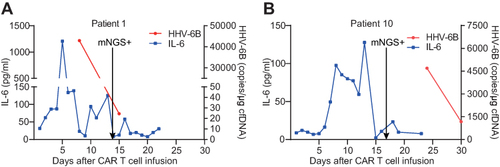
Figure 4 Differentiation of viral encephalitis caused by HHV-6B activation and ICANS after CAR T-cell therapy. (A) One case of HHV-6B encephalitis after CAR T-cell therapy. (B) Another case of ICANS after CAR T-cell therapy. Dynamic changes in IL-6 levels and HHV-6B copy number in two patients after CAR T-cell infusion. The arrows represent the first mNGS monitoring time point after CAR T infusion.