
Figures & data
Figure 1 Flow diagram of participants through study.
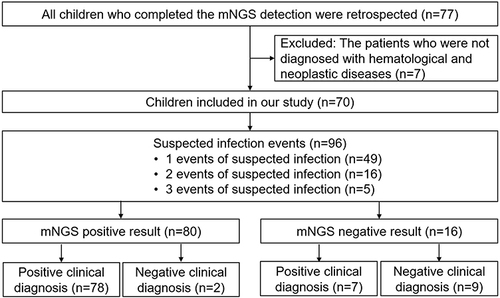
Table 1 Test Data of the 96 Suspected Infections
Table 2 Relationship Between mNGS Detection and Clinical Diagnosis
Figure 2 Microbial detection results of the 96 suspected infections.
Notes: aTMD = mNGS, TMD detected the same pathogens as reported by mNGS. bTMD ≠ mNGS, TMD detected the different pathogens as reported by mNGS; cTMD (Escherichia coli, blood culture), mNGS (Pseudomonas aeruginosa, Acinetobacter haemolyticus, Acinetobacter baumannii). After comprehensive consideration, the TMD report was clinically relevant; dTMD (Staphylococcus epidermidis, blood culture), mNGS (Klebsiella pneumoniae). The patients of the two suspected infections were different, but the test results are the same. After comprehensive consideration, the mNGS report was clinically relevant. The TMD reports were considered to be specimen contamination during percutaneous puncture; e(1) TMD (Escherichia coli, fecal culture), mNGS (Mycobacterium abscessus); (2) TMD (Escherichia coli, fecal culture), mNGS negative. Results of two independent suspected infection courses in a single patient. The final diagnosis was drug-induced fever. When the patient had no suspected infection symptoms in the past, the fecal culture also reported Escherichia coli. The TMD reports were considered as microbial colonization; f(1) TMD (Achromobacter xylosoxidans, blood culture), mNGS negative; (2) TMD (Enterobacter cloacae, Serratia marcescens, blood culture), mNGS negative. The TMD report was clinically relevant.
Abbreviations: TMD, traditional microbial detection; mNGS, metagenomic next-generation sequencing; TP, true positive; FP, false positive; TN, true negative; FN, false negative.
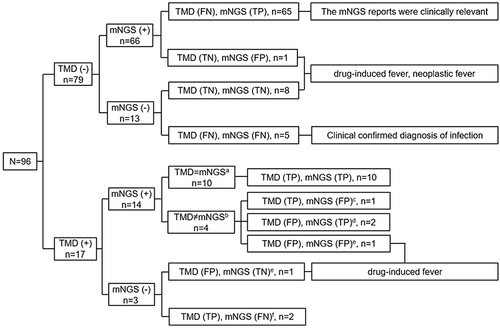
Figure 3 Results of pathogenic microorganisms in mNGS.
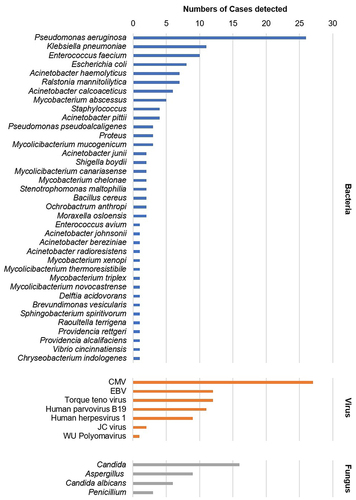
Table 3 Relationship Between Sampling Time of mNGS and Fever Time and Treatment Cost