
Figures & data

© 2022 Li et al. This work is published by Dove Medical Press Limited, and licensed under Creative Commons Attribution - Non Commerical (unported, v3.0) License. Non-commercial uses of the work are permitted without any further permission from Dove Medical Press Limited, provided the work is properly attributed.
Figure 1 Subject screening, enrolment and research flow chart.
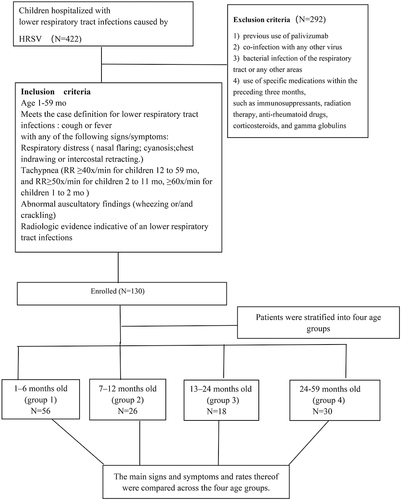
Table 1 Patient Characteristics and Clinical Signs and Symptoms
Figure 2 Proportions of patients who developed fever in each age group are shown in (A), and proportions of patients who developed the highest temperature of ≥ 38.5°C in each age group are shown in (B). P-values by Fisher’s exact between the age-group 1–6 months and other age groups are shown above the bars, patients of 1–6 months old less frequently experienced fever and the highest body temperature of ≥ 38.5°C compared with other age groups. ** P <0.01, **** P <0.0001.
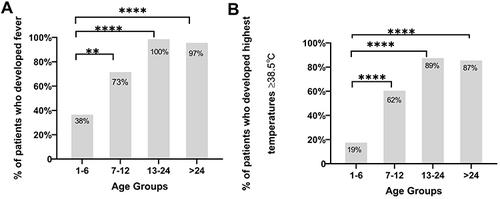
Figure 3 Proportions of patients who developed wheezing in each age group. P-values found using by Fisher’s exact test indicating differences between children in 1–6 months old and other age groups are shown above the bars. Patients patients of 1–6 months old experienced wheezing more frequently than those over 12 months old. **** P <0.0001.
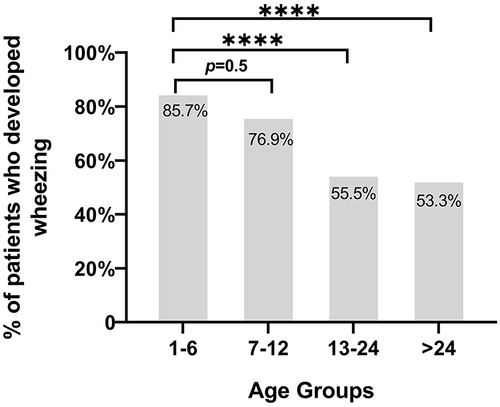
Figure 4 Proportions of patients who developed tachypnoea, hypoxia, and intercostal retractions in each age group are shown in 4A, 4B and 4C, respectively. P-values found using Fisher’s exact test indicating differences between children in 1–6 months old and other age groups are shown above the bars. Patients in 1–6 months old experienced tachypnoea, hypoxia, and intercostal retractions more frequently than children over 12 months old.* P <0.05, ** P <0.01, *** P < 0.001.
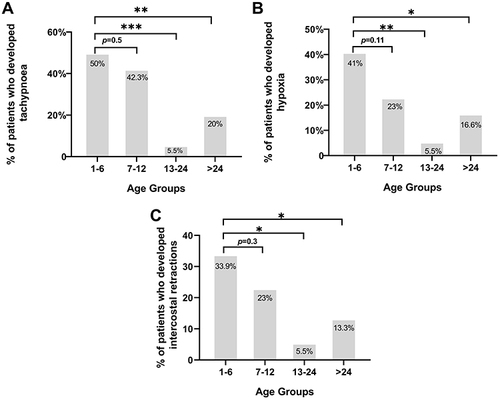
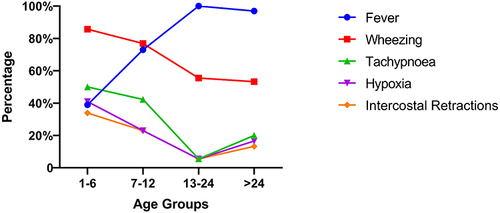
Figure 5 Age-dependent clinical characteristics trend was shown, fever responses were enhanced with advancing age among children under 24 months old, and wheezing, tachypnoea, hypoxia, intercostal retractions were reduced with advancing age among children under 24 months old.
Data Sharing Statement
The key information and data generated and analyzed during this are given in this article.