Figures & data
Table 1 Bacterial Concentration of Indoor Air Taken from Major and Gyne ORs and Wards Expressed as CFU/dm2/Hr and CFU/m3, in Dilchora Referral Hospital, Dire Dawa, Ethiopia
Table 2 Percentage of Indoor Air of Different Sites Against the Standard, in Dilchora Referral Hospital, Dire Dawa, Ethiopia
Table 3 Time Variation of Indoor Air Samples Against the Standard, in Dilchora Referral Hospital, Dire Dawa, Ethiopia
Table 4 ANOVA for Mean Difference of Bacterial Load and Magnitude of the Effect Size Among Investigated Wards and Clothing Rooms, in Dilchora Referral Hospital, Dire Dawa, Ethiopia
Table 5 ANOVA for Mean Difference of Sampling Time Variations in Bacterial Load Among Investigated Wards and Rooms, in Dilchora Referral Hospital
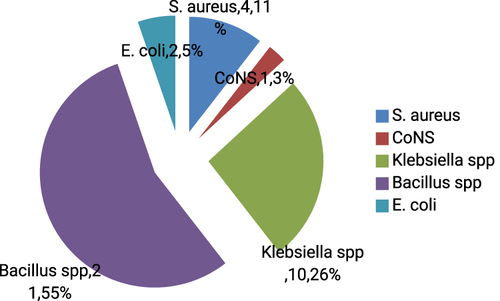
Figure 1 Proportion of bacteria isolated from Indoor air of operation theater and surgical wards in Dilchora Referral Hospital, Ethiopia.
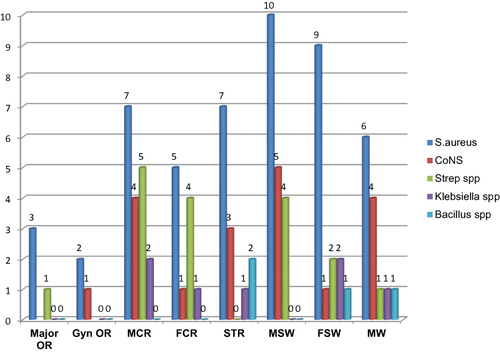
Figure 2 Bacterial species Isolated from Surface articles and equipment of OR in Dilchora Referral Hospital, Ethiopia.