Figures & data
Table 1 Categorical and Essential Agreements of Two Different Growth Supplements for 8 Antibiotics
Table 2 The Percentage (%) of N. Gonorrhoeae Isolates with Different MICs (Mg/L) for Eight Antibiotics in Different Groups
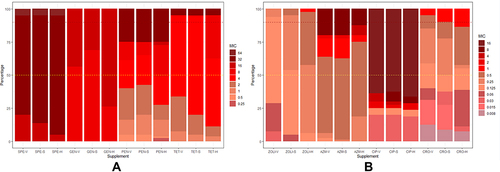
Figure 1 (A and B) The proportions of N. gonorrhoeae isolates with different MICs for eight antibiotics in different groups. The MIC50 (yellow-dotted line), MIC90 (red-dotted line) and number of isolates per province are shown. The block color represents the MIC value and the block length represents the percentage. The vertical coordinate represents the antibiotics of different growth supplement groups.
Abbreviations: ZOLI, zoliflodacin; CRO, ceftriaxone; PEN, penicillin; GEN, gentamicin; TET, tetracycline; SPE, spectinomycin; AZM, azithromycin; CIP, ciprofloxacin; CRO, ceftriaxone; V, Vitox; S, sheep blood; H, hemoglobin.