
Figures & data
Table 1 Infection of Two Diseases in Different Regions
Figure 1 Brucellosis infection rate.
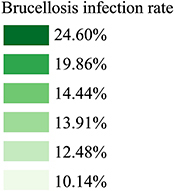
Figure 2 Distribution of brucellosis in eastern Inner Mongolia.
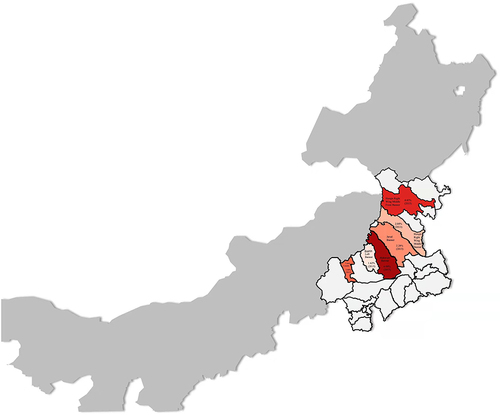
Figure 3 Q-fever distribution in eastern Inner Mongolia.
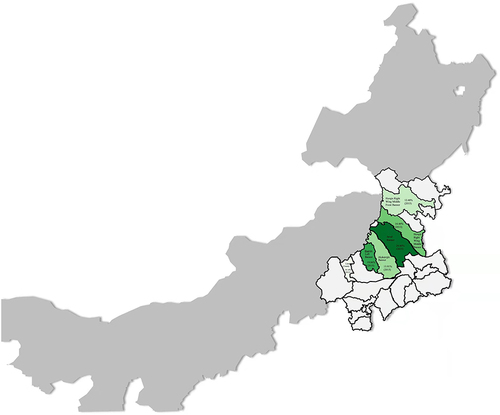
Figure 4 Q fever infection rate.
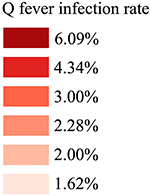
Table 2 Age Distribution
Table 3 Gender Distribution
Table 4 Occupational Distribution of Brucellosis/Q Fever
Table 5 Analysis of the Clinical Symptoms of Brucellosis/Q Fever Infection Cases
Table 6 Analysis of the Relationship Between Clinical Symptoms and Brucellosis in the Univariate Logistic Model
Table 7 Analysis of the Relationship Between Clinical Symptoms and Q Fever in the Univariate Logistic Model