Figures & data
Figure 1 The critical nodes in the diagnosis and treatment process.
Abbreviations: GBS, Group B streptococcal; WGS, whole-genome sequencing; UU, ureaplasma urealyticum.
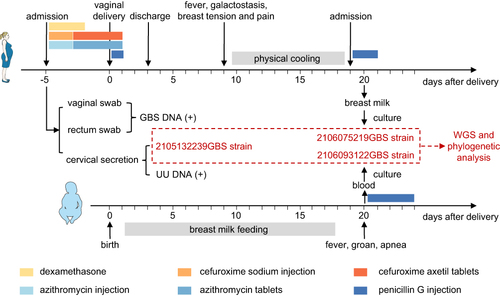
Figure 2 Phylogenetic analysis of GBS showed that all three isolates are highly related. The GBS strain isolated from the infant’s bloodstream (2106075219GBS) was 100% homologous from the GBS strain isolated from the mother’s breast milk (2106093122GBS), which differed from the GBS strain isolated from the mother’s cervical secretion (2105132239GBS).
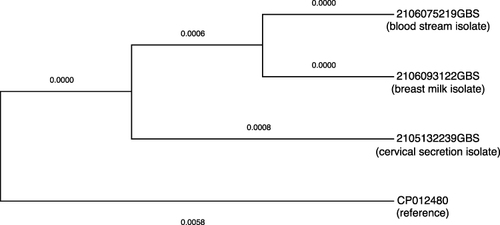
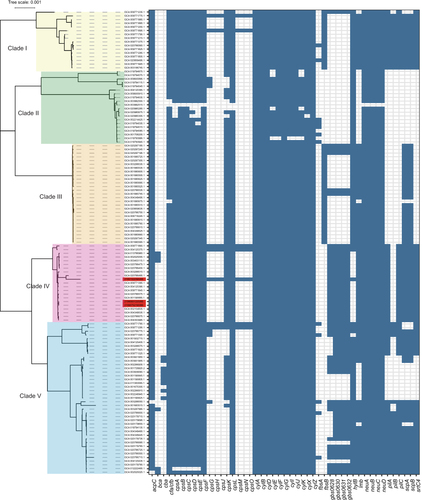
Figure 3 Core-genome phylogeny and virulence factors of GBS isolates from the NCBI genome database and the three isolates from this study. Scale bars represent the number of substitutions per site. The virulence gene distribution of GBS isolates is presented on the right. Isolates identified in this study are shown in red.