Figures & data
Figure 1 Flow chart showing difference between both group in different follow up durations.
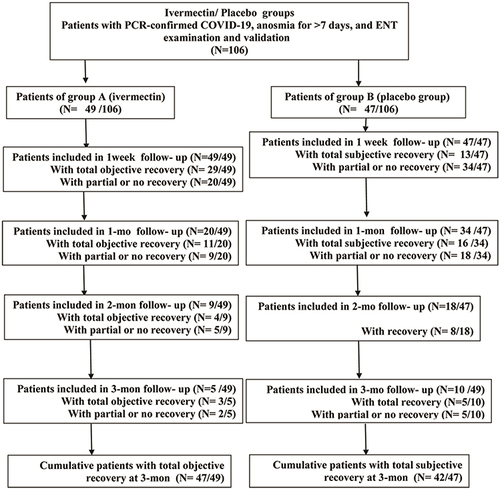
Figure 2 Characteristics of the used ivermectin nanosuspension. (A) Particle size distribution. (B) Transmission electron micrograph of the prepared ivermectin nanosuspension.
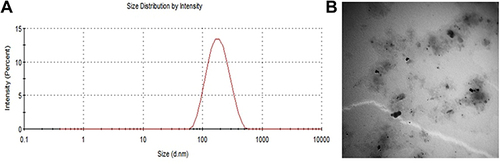
Figure 3 In-vitro release profiles of ivermectin from mucoadhesive nanosuspension in SNF (simulated nasal fluid) pH 5.5 at 37 °C. Data expressed at mean ± SD (n=3).
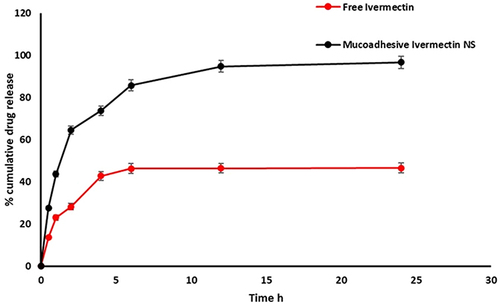
Table 1 Demographic and Clinical Data of the Study Groups
Table 2 Comparison Between the Study Groups Regarding to Anosmia Recovery at Different Follow Up Durations
Figure 4 Comparision between the study groups according to the percentage (%) of recovery of anosmia in different follow up durations (after one week, one month, two months and three months).
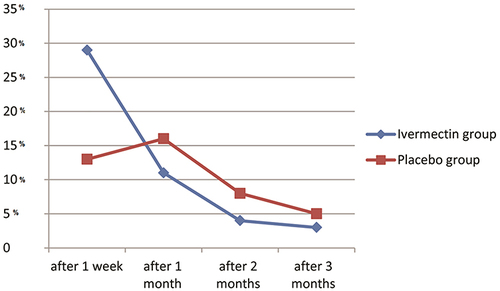
Table 3 Comparison Between the Total Duration of Anosmia Till Recovery in the Study Groups
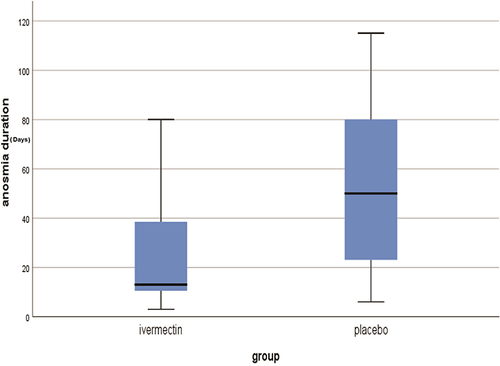
Figure 5 The median duration of post-COVID-19 persistent anosmia recovery (days) in the study groups.