
Figures & data
Table 1 Primers Used in This Study
Figure 1 Resistance to in vitro cefmetazole exposure, by MIC group, in E. coli total (A), ESBL-producing E. coli (B), and non-ESBL E. coli (C). The data shows the cumulative resistance rate and 95% CI due to everyday cefmetazole exposure.
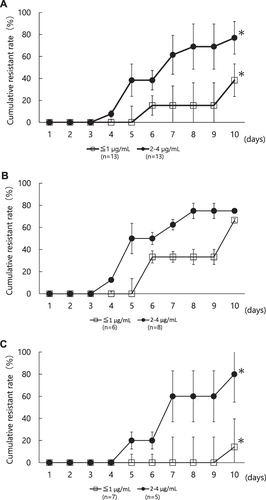
Table 2 MIC of Cefmetazole Against Escherichia Coli
Figure 2 mRNA expression levels of ompF, ompC, and phoE in resistant and non-resistant strains after 10 days of cefmetazole exposure.
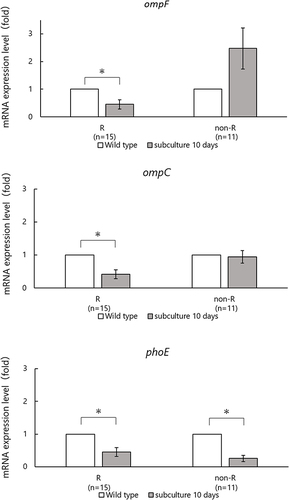
Figure 3 mRNA expression levels of chromosomal ampC, acrA, yhiV, mdfA genes in this study cefmetazole exposure assay.
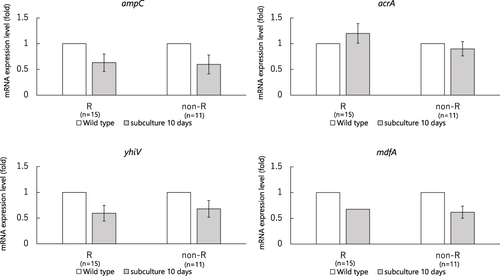
Figure 4 Resistance to in vitro cefmetazole exposure at the time of addition of relebactam.
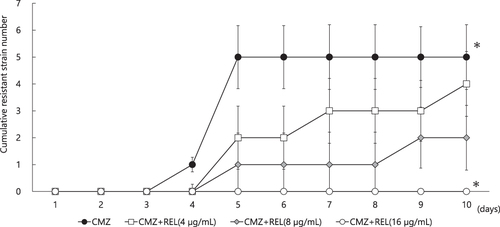
Table 3 Changes in ompF, ompC and phoE mRNA Expression in Combination with Relebactam and Cefmetazole