Figures & data
Table 1 Selection of Artemisinin and Piperaquine Resistance in P. berghei K173 Using the Serial Technique
Figure 1 Resistance index line chart (ART Vs PQ:P=0.035). After 50 generations of culture, the dosage of artemisinin-resistant culture was observed to increase from 188.85 mg/kg to 883.96 mg/kg, but the resistance index peaked at the 30th generation (I90=12.4) and began to decrease thereafter, and remained at about 5 in 30–50 generations. The dose of piperaquine resistance was increased from 6.57 mg/kg to 76.82 mg/kg, and the resistance index was increased from 3.2 in the fifth generation to 148.8 in the 50th generation.
Table 2 Comparison of Each Sequence with K13 Gene Sequence of P. berghei
Table 3 Potential Changes of P. berghei K13 Caused by Resistance Breeding
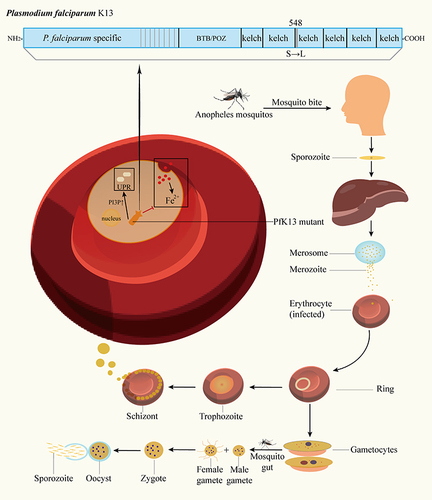
Figure 2 The growth cycle of Plasmodium and the mechanism of resistance induced by PfK13 mutation. PfK13 mutations can reduce sensitivity to artemisinin by inducing the unfolded protein response (UPR) in the resistant parasite and reducing endocytosis of hemoglobin.