Figures & data
Figure 1 Hospitalized patients were screened for CRE colonization between 2019 and 2020 (n=1203). The patients were divided into “colonized” and “uncolonized” groups, then further divided into “infected” and “uninfected” groups.
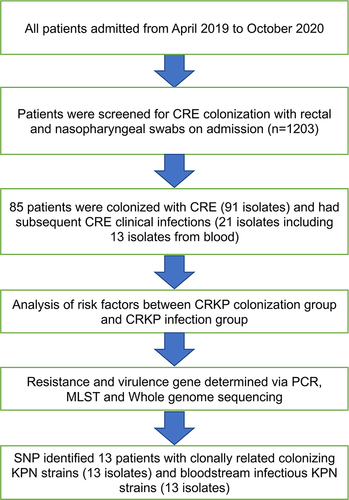
Figure 2 Isolate CRE strains distribution.
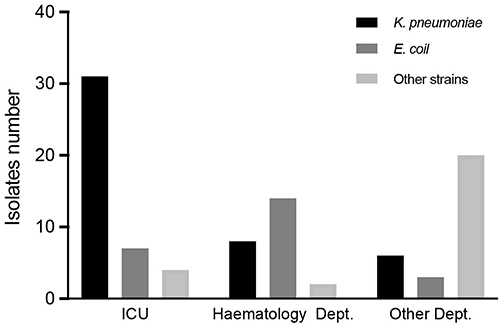
Table 1 Antimicrobial Susceptibility of Carbapenem-Resistant Enterobacteriaceae Isolated from Fecal Samples
Table 2 Molecular Characteristics of Carbapenem-Resistant Enterobacteriaceae Isolated from Faecal Samples
Table 3 Analysis of Risk Factors Between the CRKP Colonization Group and the Non-CRKP Colonization Group
Figure 3 Timeline from admission to colonization and subsequent BSI in CRKP colonized patients. The circles represent the day of colonization, while the triangles show the day of BSI. During the study, 13 patients developed BSI from their intestinal colonizing strains, showing a median time of 7 days (range: 3–13 days) from admission to colonization. The median time from CRKP colonization to BSI was 6 days (range, 2–16 days).
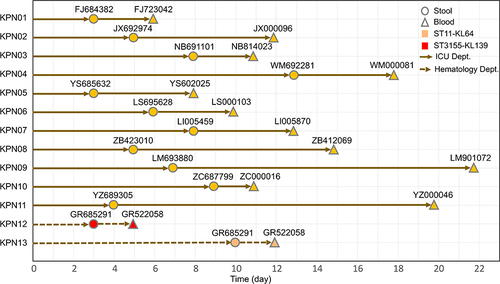
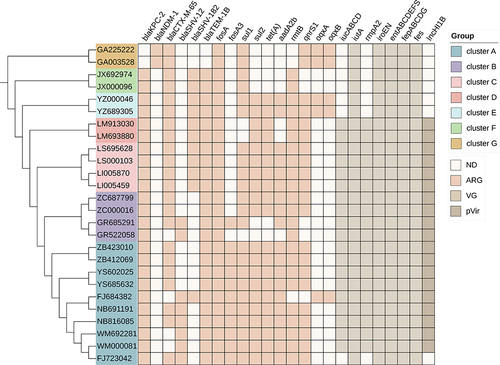
Figure 4 Core-genome phylogeny of the CRKP isolates, antimicrobial resistance genes, virulence-associated genes and virulence-associated plasmids. The maximum likelihood phylogeny tree was based on single-nucleotide polymorphisms in the core genomes of 26 CRKP isolates. Genome clusters are shaded using different colors. Distribution of virulence-associated genes, antimicrobial resistance genes and virulence-associated plasmid in CRKP strains. Heat maps were generated by aligning the draft genome sequence of each isolate with the sequences deposited in the BIGSdb Klebsiella genome database. The scale bar indicates nucleotide divergence. The origins of the isolates are shown in different colors. Antimicrobial resistance genes, virulence-associated genes and virulence-associated plasmid are shown on the top.