Figures & data
Table 1 Comparison of Clinical Features Between Groups
Figure 1 Patient recruitment flow chart.
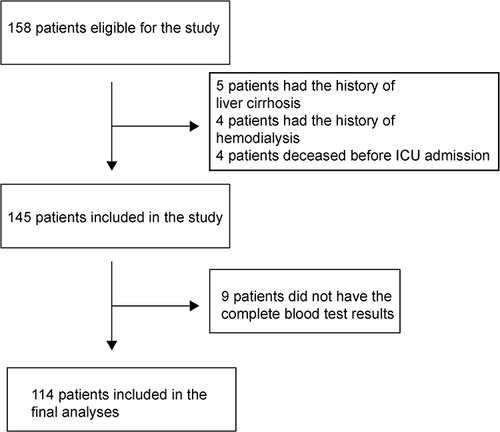
Figure 2 Correlation between albumin levels and highest body temperature during hospitalization. There was a significant negative correlation was found between albumin level and highest body temperature during hospitalization (R=−0.29, P=0.045). The solid red line and red dotted lines are the simple linear regression equation and 95% confidence interval, respectively.
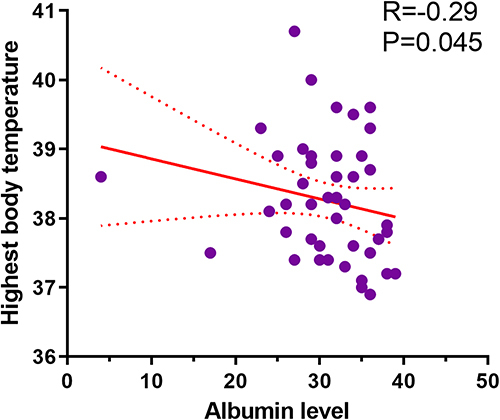
Table 2 Comparison of Laboratory Variables Between Groups
Table 3 Associations Between Albumin Concentrations After Infusion and Laboratory Variables
Figure 3 Correlation between albumin levels and IL-6 concentrations. There was a significant negative correlation was found between albumin level and IL-6 (R=−0.35, P=0.012). The solid red line and red dotted lines are the simple linear regression equation and 95% confidence interval, respectively.
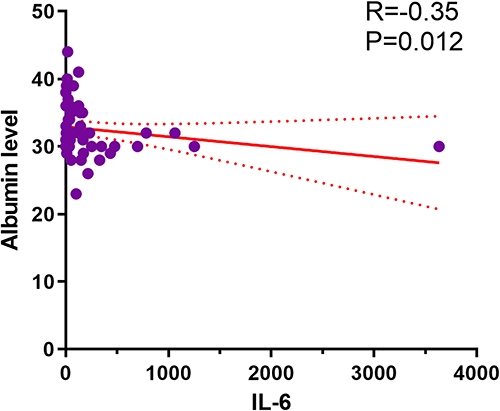
Table 4 Cox Regression Model Based on Albumin Level After Infusion
Figure 4 Kaplan-Meier survival curves of the non-albumin infusion and albumin infusion groups.
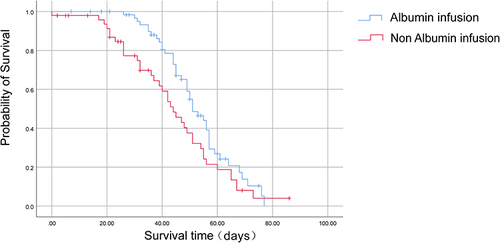
Figure 5 Kaplan-Meier survival curves of the ≤4 and >4 times infusion groups.
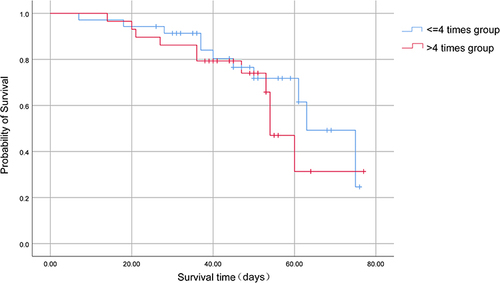
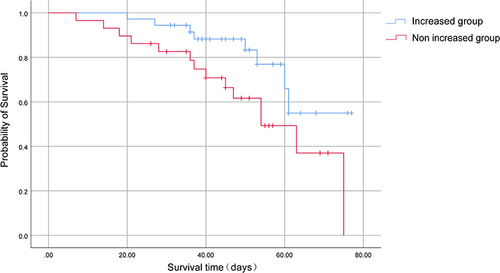
Figure 6 Kaplan-Meier survival curves of increased and non-increased groups.