Figures & data
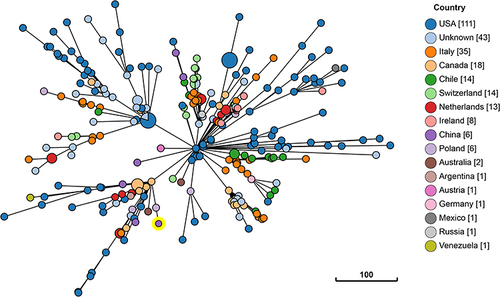
Figure 1 A minimum spanning tree based on cgMLST analysis of L. monocytogenes ST1 isolates retrieved from NCBI GenBank database. Each circle represents strains belong to the same complex type. The size of the nodes reflects the number of isolates contained within the clade. Clonal relationships between isolates are depicted by the line length connecting each circle. The number of isolates recovered from each country is given in square brackets.