Figures & data
Table 1 Criteria of the Howell-PIRO System (Not Included Malignancy)
Figure 1 Flowchart of the study population.
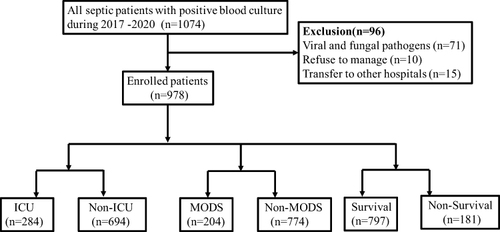
Table 2 Characteristics of the Study Cohort
Figure 2 The median levels of SOFA, MEDS and PIRO scores, and mean level of APACHE II score in ICU-admission, developing of MODS and 28-day mortality groups. (A) The median level of SOFA score in ICU-admission, developing of MODS and 28-day mortality groups. (B) The median level of MEDS score in ICU-admission, developing of MODS and 28-day mortality groups. (C) The mean level of APACHE II score in ICU-admission, developing of MODS and 28-day mortality groups. (D) The median level of PIRO score in ICU-admission, developing of MODS and 28-day mortality groups.
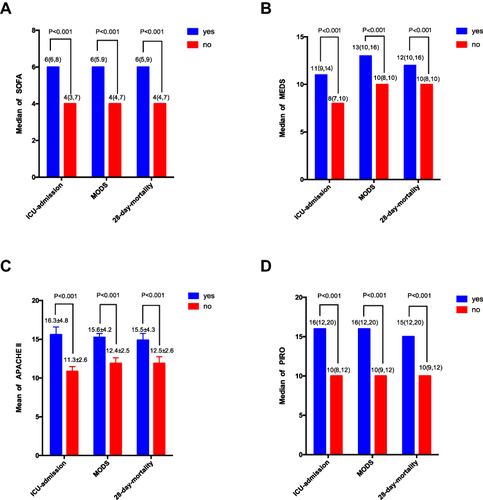
Figure 3 Spearman correlations between 28-day mortality and SOFA score (A); MEDS score (B); APACHE II score (C); PIRO score (D) in patients with positive blood cultures.
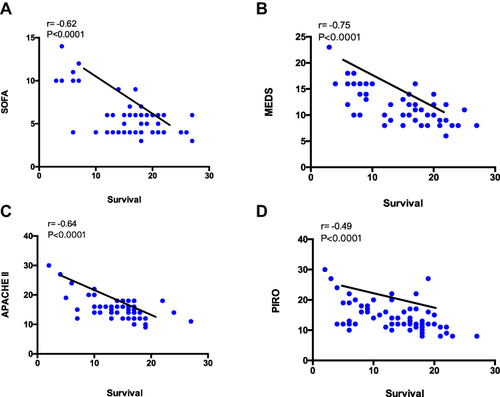
Table 3 Binary Logistic Regression Analysis of Clinical Outcome for Septic Patients with Positive Blood Culture
Table 4 Statistical Data of ROC Curve in Predicting ICU-Admission in Patients with Positive Blood Cultures
Table 5 Statistical Data of ROC Curve in Predicting MODS in Patients with Positive Blood Cultures
Table 6 Statistical Data of ROC Curve in Predicting 28-Day-Mortality in Patients with Positive Blood Cultures
Figure 4 The ROC curves of PCT combined with severe scores for predicting outcomes in septic patients with positive blood cultures for ICU-admission, developing of MODS and 28-day mortality. (A) The ROC curves of PCT combined with severe scores in septic patients with positive blood cultures for ICU-admission; (B) the ROC curves of PCT combined with severe scores in septic patients with positive blood cultures for developing of MODS; (C) the ROC curves of PCT combined with severe scores in septic patients with positive blood cultures for 28-day mortality.
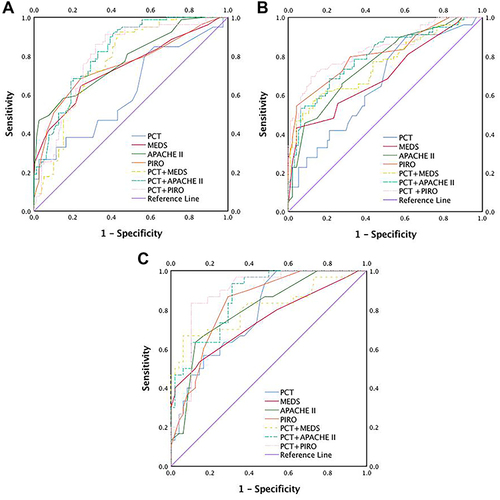
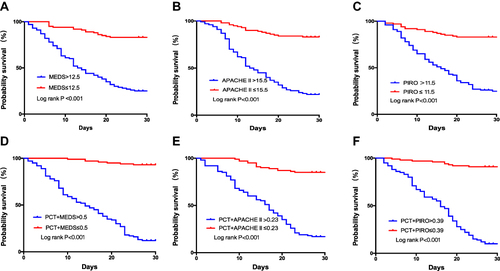
Figure 5 Kaplan-Meier curves for 28-day survival categorized by the MEDS score (A), APACHE II score (B), PIRO score (C), and combination value of PCT+MEDS (D), PCT+APACHE II (E), and PCT+PIRO (F) in septic patients with positive blood cultures.