Figures & data
Table 1 Bacterial Strains and Plasmids
Table 2 Primers Used for RT-PCR and CRISPRi System
Figure 1 An arabinose-inducible CRISPRi system for tunable repression of PA0715 expression in P. aeruginosa.
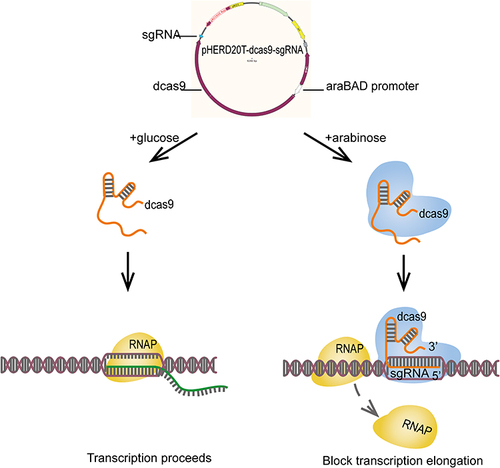
Figure 2 PA0715 and its putative expression product.
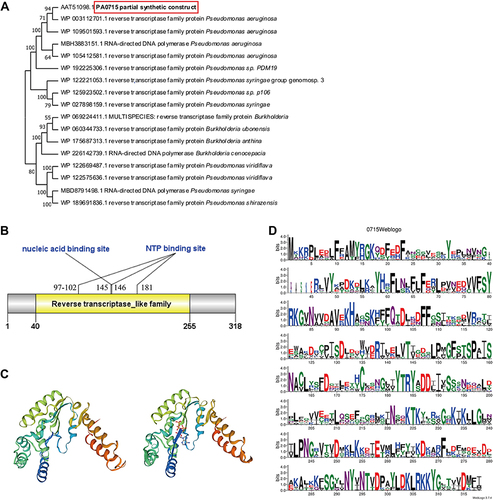
Figure 3 Effect of PA0715 suppression on the proliferation and activity of PAO1 strains.
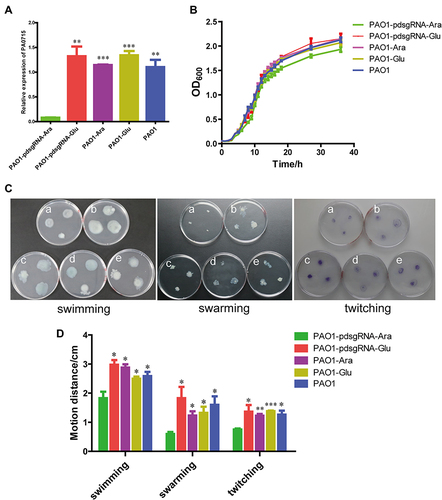
Figure 4 Changes in pyocyanin production and biofilm formation due to PA0715 inhibition.
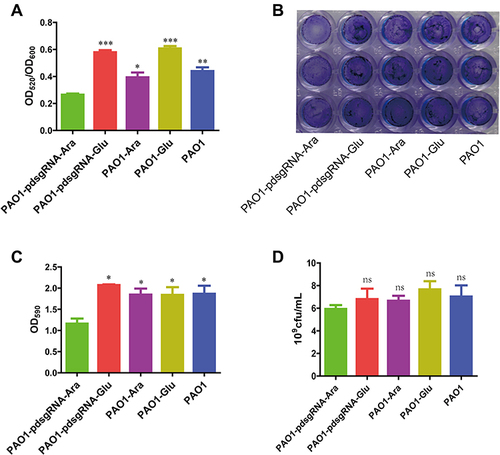
Table 3 MIC of the Four Antibiotics Against PAO1 Strains Under Different Conditions (μg/mL)
Table 4 Expression of Part Genes Related to Motility and Attach-Ment, Biofilm Formation, Antibiotic Resistance and Susceptibility and Oxidative Phosphorylation
Figure 5 SEMimages of PA0715 being or not being inhibited by PAO1 cells.
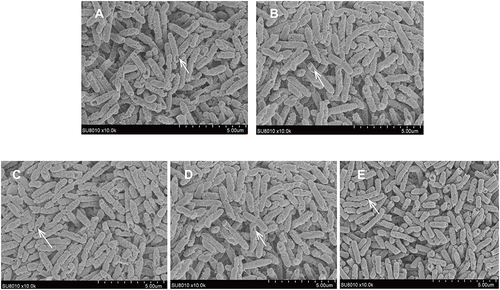
Figure 6 Survival of Galleria mellonella inoculated with PA0715-suppressed or control strains.
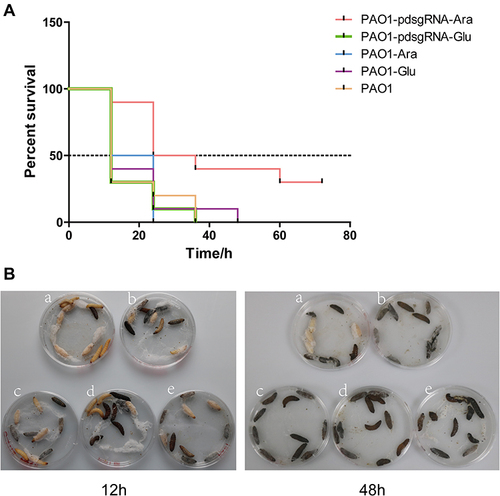
Figure 7 Volcano map of genes regulated by PA0715, and functional classification based on the Gene Ontology (GO) database (http://www.geneontology.org).
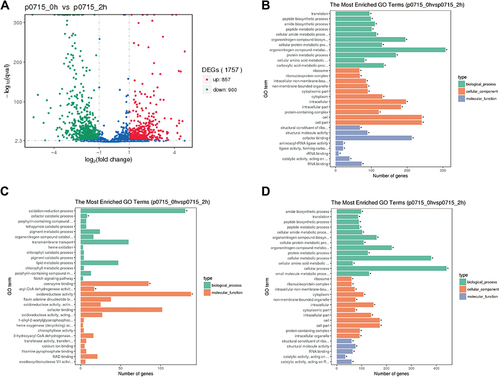
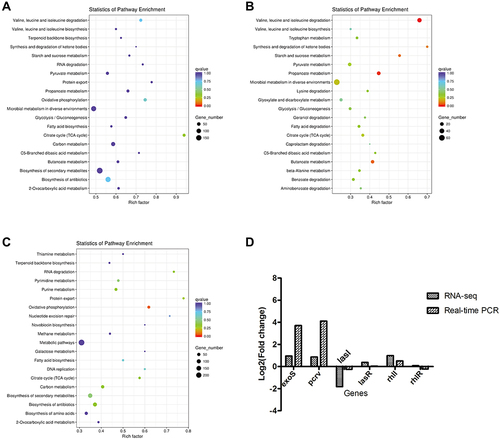
Figure 8 KEGG functional annotation and RT-qPCR validation of differential genes in PAO1 strains with or without PA0715 being repressed.