Figures & data
Figure 1 Timeline of the disease. Lung CT scan at different time points were listed. Isolation of strain FJ0318 and FJ0322 were marked with triangle.
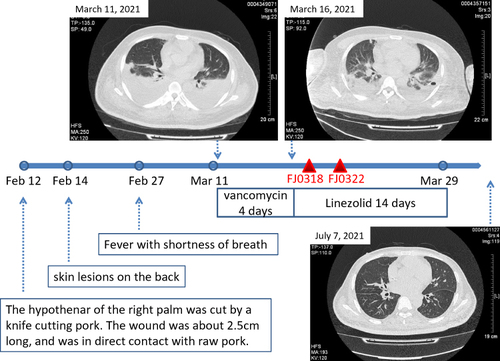
Table 1 Antimicrobial Susceptibility Testing of Strains
Figure 2 Structure of pTET-ST7, the plasmid in strain FJ0318. The inner circle represents GC content. The outer circle represents ORFs. The resistance genes, replications, transposable elements, and plasmid recombination were shown beside the relevant ORFs. The plasmid sequence was aligned to pE2, pN315, SR153_pSR02 and pT8G. The relevance of circle color and plasmid was in top right corner.
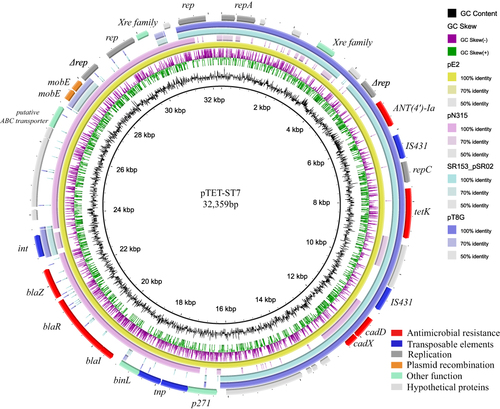
Table 2 Genomic, Pathogenicity Islands and Virulence Genes in FJ0318
Figure 3 Chromosome of FJ0318 and FJ0322. The inner circle represents GC content and GC skew. The outer circle represents genomic islands and prophage. The relevance of circle color and strain was in top right corner.
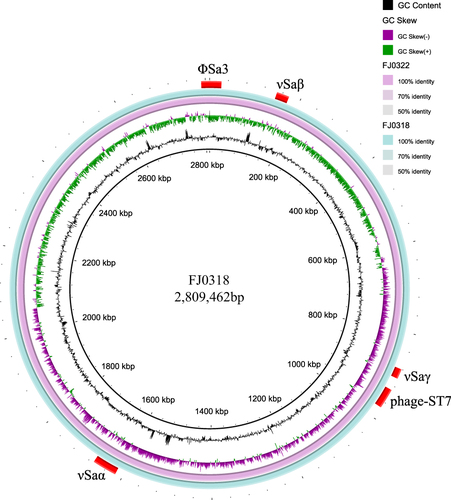
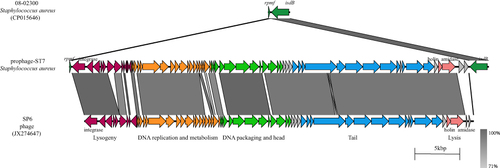
Figure 4 Structure and comparative analysis of prophage page-ST7. Compared with MSSA ST7 strain 08–02300 (CP015646) and Staphylococcus aureus phage SP6 (JX274647).