
Figures & data
Table 1 Primers’ Sequences and Amplicons’ Size Used in PCR for Carbapenemase, Integrons and fosA Genes Detection
Table 2 Antimicrobial Susceptibility Pattern of the Uropathogenic CRE Strains
Figure 1 Meropenem/vaborbactam and fosfomycin susceptibility testing using the MIC Test Strip according to CLSI guidelines. (A) Meropenem/vaborbactam susceptible strain (MIC = 0.032 µg/mL), (B) meropenem/vaborbactam resistant strain (MIC > 256 µg/mL), (C) fosfomycin susceptible strain (MIC = 0.25 µg/mL) and (D) fosfomycin resistant strain (MIC > 256 µg/mL).
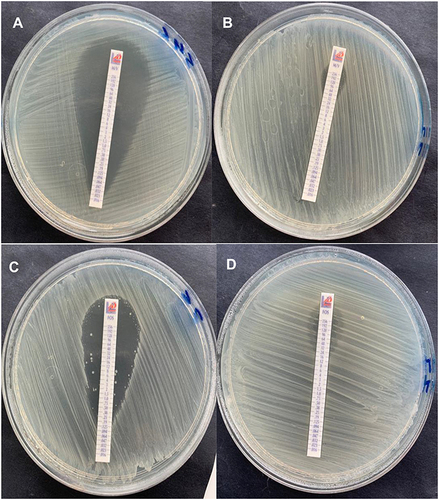
Table 3 Detection of Carbapenemase and Integrons Genes by PCR and the Sensitivity of CRE Isolates to Meropenem/Vaborbactam
Table 4 Performance of the Modified Carbapenem Inactivation Method (mCIM) and EDTA-Modified Carbapenem Inactivation Method (eCIM) in Screening of Carbapenemase Activity of Carbapenem Resistant Isolates
Table 5 Antibiotic Resistance Pattern and the Distribution of Integron and fosA Genes Among Carbapenemase Producing Enterobacterales (CPE) and Non-CPE Isolates