Figures & data
Table 1 Primers Used in This Study
Table 2 Isolation Spot and Resistance Genes of Seven Shewanella xiamenensis
Table 3 Antimicrobial Drug Susceptibility of Seven Shewanella xiamenensis*
Figure 1 Phylogenetic trees of OXA-48-like genes and Shewanella xiamenensis strains. (A) Phylogenetic trees of OXA-48-like genes. blaOXA-48 genes have three genotypes despite being the same amino acid sequences while blaOXA-181 gene only has one genotype. Plasmid-borne and chromosome-borne blaOXA-48 displayed some nucleotide variations but blaOXA-181 were identical; (B) Phylogenetic trees of Shewanella xiamenensis strains. Seven S. xiamenensis genomes were distributed into different clades of the tree, and the phylogenetic clades in general correlated with the blaOXA-48-like gene sequences. Bootstrap values for each cluster of associated taxa are shown next to each branch. Bar corresponds to the scale of sequence divergence. Shewanella xiamenensis from our study were characterized in boldly red.
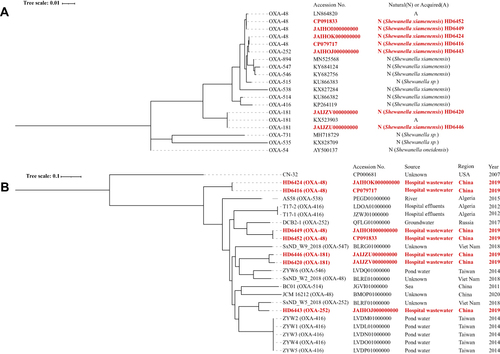
Figure 2 Plasmid structure comparison between blaNDM-1-harbouring pHD6416 and the other strains. The backbone region of pHD6420, pHD6424, pHD6443, pHD6446 was highly comparable with pHD6416 backbone, respectively, while pHD6449 and pHD6452 contain a different backbone. The multidrug-resistant regions of the seven plasmids were also highly comparable with just a few mobile elements different. Colored arrows indicate ORFs, with navy, yellow, Orange, olive, purple and green arrows representing plasmid backbone genes, mobile elements, plasmid transfer genes, Tn6358b/c backbone genes, the antimicrobial and heavy metal resistance genes, respectively.
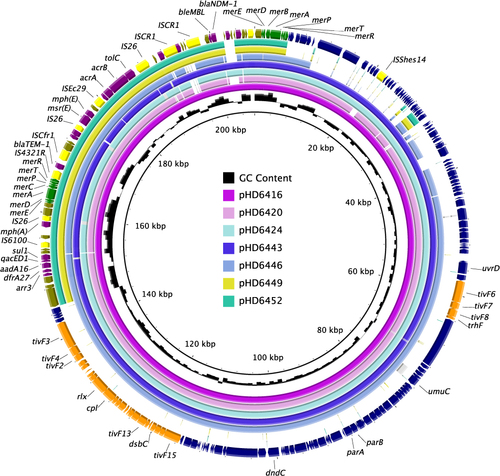
Figure 3 Linear comparison of Tn6358a, Tn6358b, Tn6358c. The MDR regions from pHD6416 and pHD6452 were highly similar and could evolve from the same Tn element. Genes are denoted by arrows. Gene, mobile elements, and other features are colored based on their functional classification. Shading denotes regions of homology (nucleotide identity ≥95%). Numbers in brackets indicate nucleotide positions within the plasmid pHD6416-NDM and pHD6452-NDM. Tn6358a was used as reference and its accession number was JX141473.
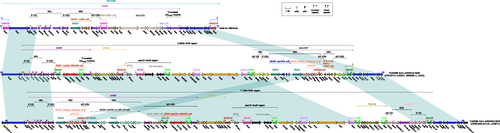
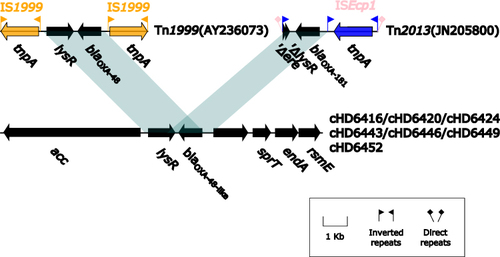
Figure 4 Linear Comparison of blaOXA-48-like-related region and related regions. Genes are denoted by arrows. Shading denotes regions of homology (nucleotide identity ≥90%). Sequences of Tn1999 and Tn2013 are acquired from pOXA-48a plasmid and pKP3-A plasmid on NCBI, respectively, and accession numbers are noted in bracket.