Figures & data
Table 1 MIC Values of Commonly Used Clinical Antibiotics Against FK8578 and FK8695
Figure 1 Time courses of infection and treatment among a patient in whom CZA-resistant K. pneumoniae emerged.
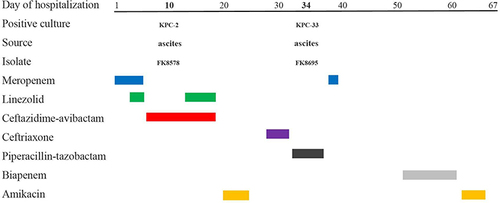
Figure 2 Mucoviscosity and capsular polysaccharide (CPS) production. (A) Mucoviscosity. The string test was used to assess the hypermucoviscosity of K. pneumoniae strains. A string of 5 mm or longer is defined as positive. (B) CPS production of FK8578 and FK8695. ***P < 0.001.
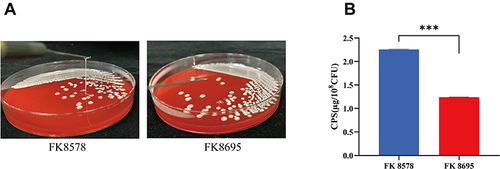
Figure 3 Biofilm formation ability and Galleria mellonella infection model in K. pneumoniae FK8578 and FK8695 strains. (A) Biofilm formation analysis of K. pneumoniae FK8578 and FK8695. (B) The survival rate of G. mellonella after 7 days on K. pneumoniae FK8578 and FK8695. ***P < 0.001.
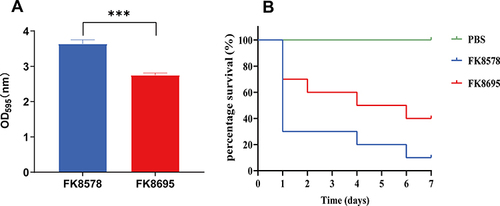
Table 2 General Features of FK8695
Table 3 Minimal Inhibitory Concentrations (MICs) of FK8578, FK8695 and the blaKPC-33-Positive E. coli Transconjugant of FK8695
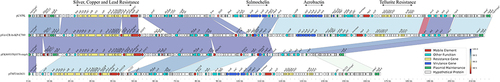
Figure 4 Alignment of blaKPC-33-carrying plasmids. Circles 1–5 (from inside to outside) represent the information as follows: (1) GC skew, (2) GC content, (3) MT550691, (4) CP050351, (5) CP025144, (6) negative-strand CDSs of pFK8695-KPC-33, (7) positive-strand CDSs of pFK8695-KPC-33. Functional features of pFK8695-KPC-33 are highlighted in different colors. The genetic context of blaKPC-33 gene among these plasmids is shown in the upper right corner of the map.
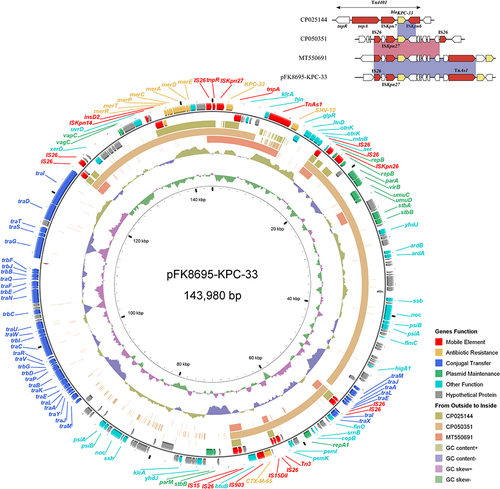
Figure 5 Comparative genetic analysis of rmpA1-carrying plasmids. The arrows represent sequence units or genes and are colored based on the gene function classification. Orthologous regions are connected and color coded.