Figures & data
Table 1 Demographic Characteristics of the Study Participants
Figure 1 Genotyping success rates of different viremia categories. (A) Genotyping success rates of different viremia categories at protease and reverse transcriptase regions. (B) Genotyping success rates of different viremia categories at integrase region.
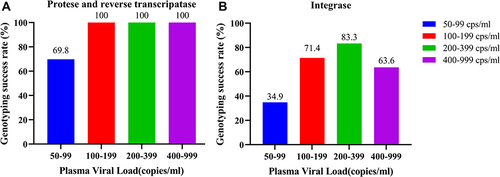
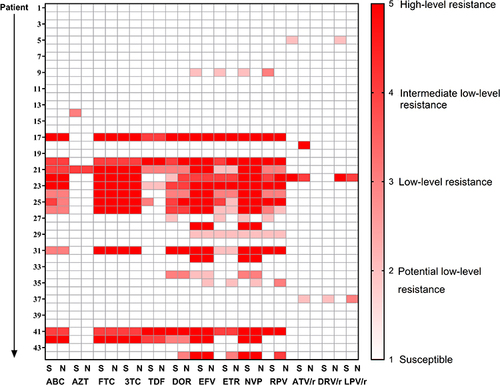
Figure 2 Patterns of DRMs in HIV-infected patients with LLV.
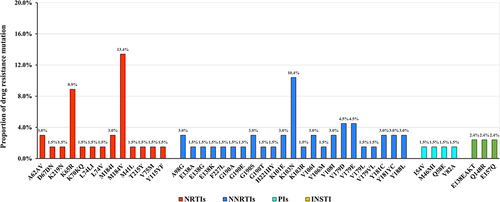
Figure 3 Different levels of drug resistance in HIV-infected patients with LLV.
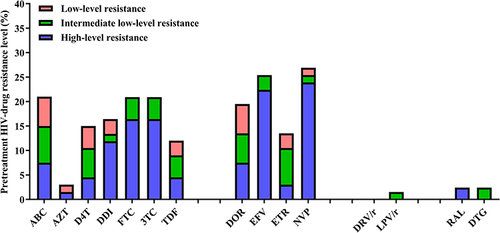
Table 2 Drug Resistance Mutations in 8 Patients with Intermittent LLV
Table 3 Drug Resistance Mutations in 18 Patients with Persistent LLV
Table 4 DRMs Detected by NGS but Missed by SS at the Threshold of 5%
Table 5 DRMs Detected by SS but Missed by NGS at the Threshold of 5%
Figure 4 Comparison of drug resistance interpretation between SS and NGS.