
Figures & data
Table 1 Sequences of Primers for PCR of Biocide Resistance Genes
Figure 1 The distribution of biocide resistance genes in different groups. (A) MRSA and MSSA, (B) educational ages, and (C) four main clonal complex (CC) genotypes among 722 S. aureus isolates from school-age students in Guangzhou. The data shown above the column are percentages in that population. “*” indicates statistics which were significantly different (P<0.05).
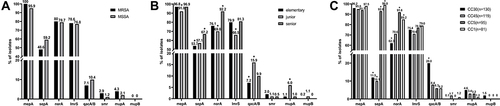
Table 2 Association Between ten Biocide Resistance Genes and Conventional Antibiotic Resistance Among 722 Staphylococcus Aureus Isolates
Table 3 The Susceptibility to CHG & Mupirocin and Biofilm Formation Ability of qacA/B and mupA Genes Positive Isolates
Figure 2 CC genotype distribution of (A) CHG and (B) mupirocin resistance isolates. “Others” represent CC8, CC25, CC121, CC944 and CC1610 genotypes; each includes only one isolate.
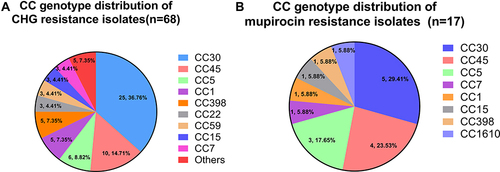
Table 4 Relationship Between CHG & Mupirocin Susceptibility and Biofilm Formation Ability Among qacA/B & mupA Positive Isolates