Figures & data
Table 1 Multidrug Resistance Profile of blaNDM-5-Carrying E. coli B379 in This Study
Figure 1 Circular map of plasmid pB379_NDM. Genes at the outermost ring shown in blue, aqua, fuchsia, and orange were respectively involved in stability, propagation, replication, and application. The resistance genes were indicated in red. Hypothetical protein or other coding sequences (CDSs) are indicated in gray.
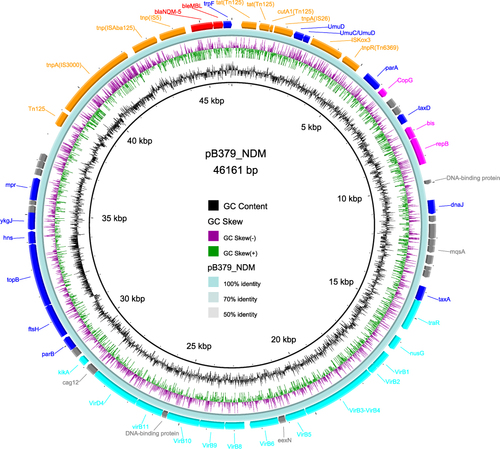
Figure 2 Schematic map of plasmid blaCTX-M-14-carrying plasmid pB379_3. Genes are denoted by arrows, and the function of genes were annotated with different colours.
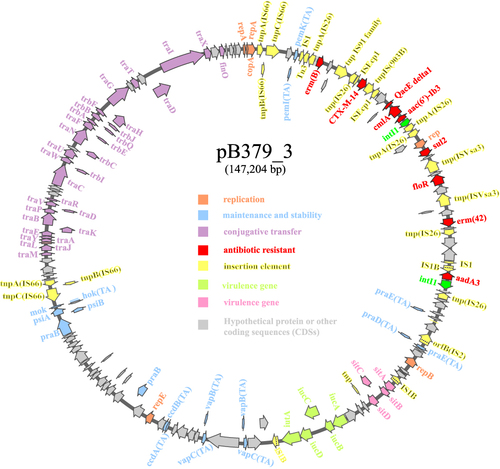
Figure 3 Linear comparison of MDR region of plasmid pB379_3 with pEH13_2. Genes are denoted by arrows. The same color denotes the same gene cluster of them. White and black represent different regions between the two plasmids. Shading indicates regions of homology (>95% nucleotide identity).
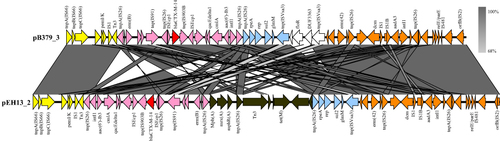
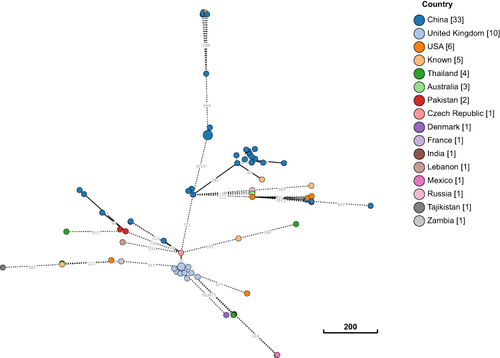
Figure 4 Phylogeny between E. coli B379 and all ST746 strains currently available in public database. The clonal relationship between two isolates is depicted by lines connecting the circles. The scale bar indicates the allelic difference between two isolates. In square brackets, the number of isolates from each nation is shown.