Figures & data
Table 1 Rescue Primers Used When Samples Failed to Amplify
Table 2 Baseline Demographics and Clinical Characteristics for Study Participants
Figure 1 Genotyping success of in-house RNA-based HIV genotyping assay, overall and stratified by VL group.
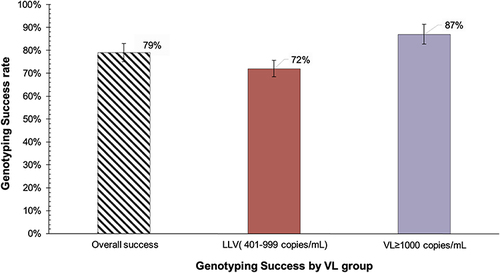
Figure 2 Association of genotyping outcomes with viral load measurement.
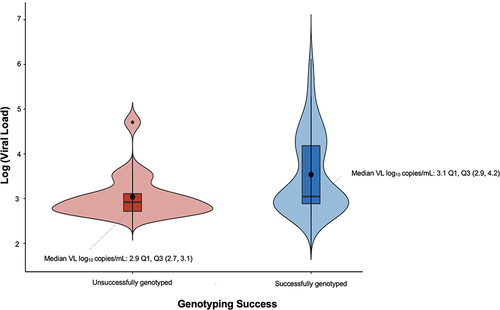
Figure 3 Maximum likelihood phylogenetic tree constructed using 1000 bootstrap values showing the uniqueness of the sequences and that there is no clustering of sequences by their VL group. The light-blue dot represents standard HIV reference strain.
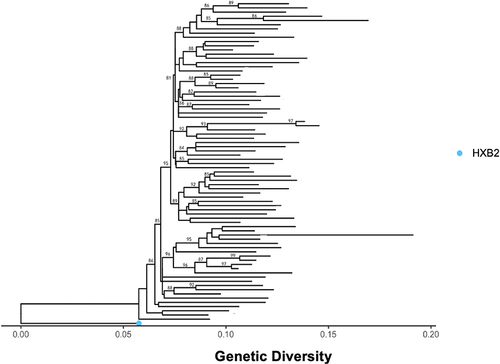
Table 3 Prevalence of HIV DRM, Overall and by VL Groups
Figure 4 HIV DRM classified by NRTI and NNRTI resistance classes (N=76) using an in-house RNA-based HIV genotyping assay with detectable plasma HIV-1 RNA > 400 copies/mL.
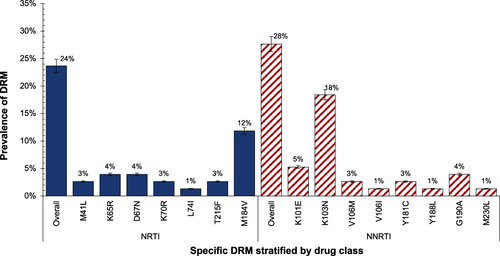
Figure 5 NRTI-associated resistance mutations stratified by VL groups.
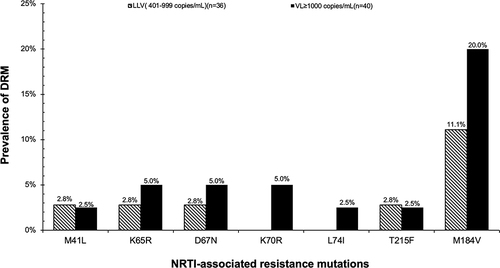
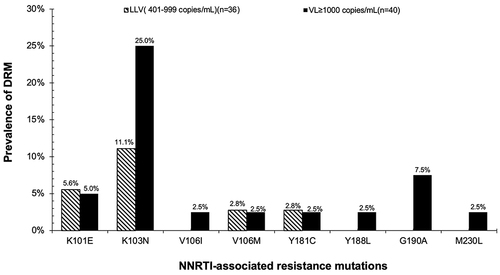
Figure 6 NNRTI-associated resistance mutations are stratified by VL groups.