Figures & data
Figure 1 The workflow of this study.
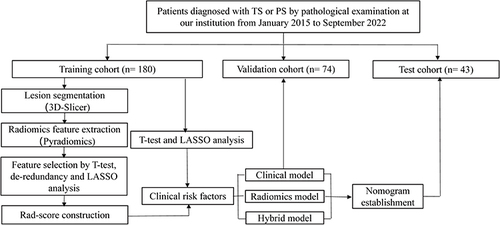
Table 1 Comparison of Clinical Data in TS and PS
Figure 2 Identification of optimal characteristics and clinical risk factors by LASSO. (A) LASSO coefficient profiles of the clinical risk factors. (B) The clinical risk factors were screened out by tuningλusing LASSO via minimum binomial deviation. (C) LASSO coefficient profiles of the radiomics features. (D) The most valuable features were screened out by tuningλusing LASSO via minimum binomial deviation.
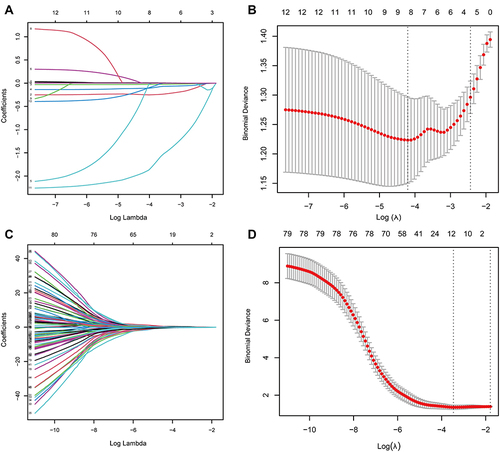
Figure 3 The 12 optimal radiomic features chosen for the radiomics model and the LASSO regression coefficient of features.
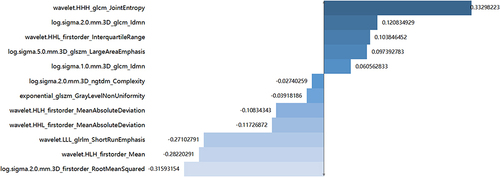
Figure 4 Comparative analysis of Rad-scores in TS and PS groups in the training (A) and validation (B) cohort.
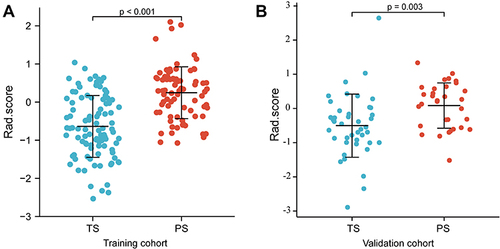
Figure 5 The predictive clinical-radiomics nomogram for differentiating TS from PS.
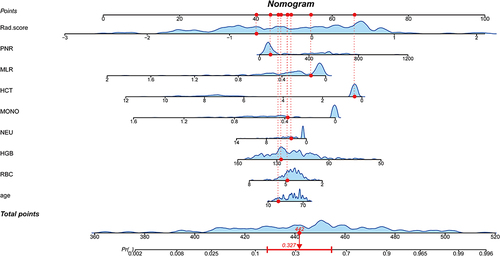
Figure 6 ROC curves of the clinical, radiomics, and combined models in the training (A) and validation (B) cohort.
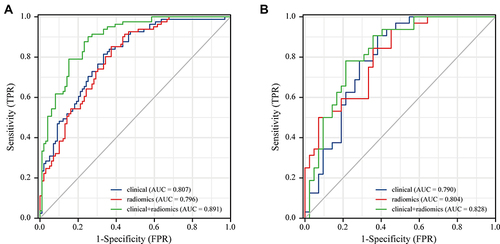
Figure 7 The clinical-radiomics nomogram calibration curve in the training (A) and validation (B) cohort.
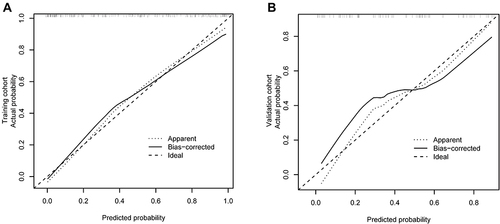
Figure 8 The decision curve analysis for the clinical, radiomic, and combined models in the training (A) and validation (B) cohort. The y-axis indicates the net benefit; the x-axis indicates threshold probability.
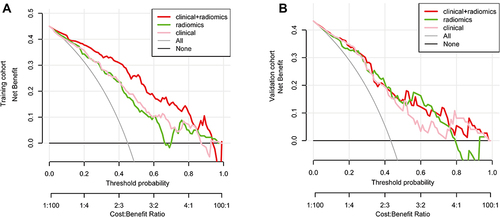
Table 2 Diagnostic Performance of Each Model in the Training and Validation Cohorts
Figure 9 The radar chart shows the diagnostic performance of clinical, radiomic, and combined models in the training (A) and validation (B) cohort.
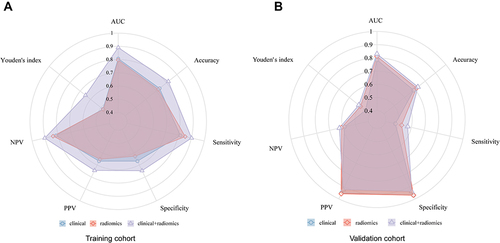
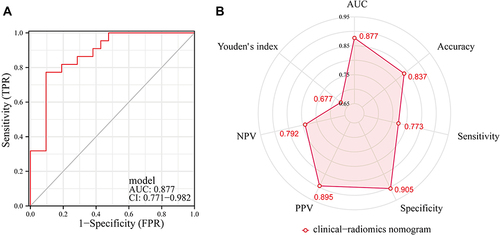
Figure 10 The discriminative performance of the clinical-radiomics nomogram model in the test cohort. (A) The ROC curve of the clinical-radiomics nomogram model in the test cohort. (B) The radar chart shows the diagnostic performance of the clinical-radiomics nomogram model in the test cohort.