Figures & data
Table 1 Primers Used in This Study
Table 2 Distribution of Virulence Genes in EPEC Isolates
Table 3 Antibiotic Susceptibility of Typical, Atypical EPEC and Non-EPEC Isolated from Patients with Diarrhea
Figure 1 Representative gel electrophoresis of ERIC-PCR using ERIC2 primer. Lane 1: molecular mass ladder and lanes 2 to 20: isolates of typical and atypical EPEC from humans in the Eastern Province of Saudi Arabia.
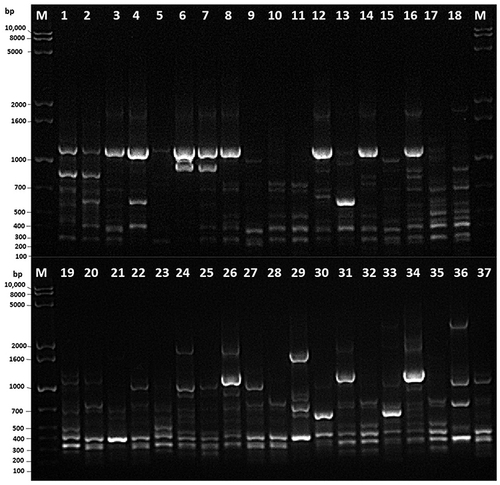
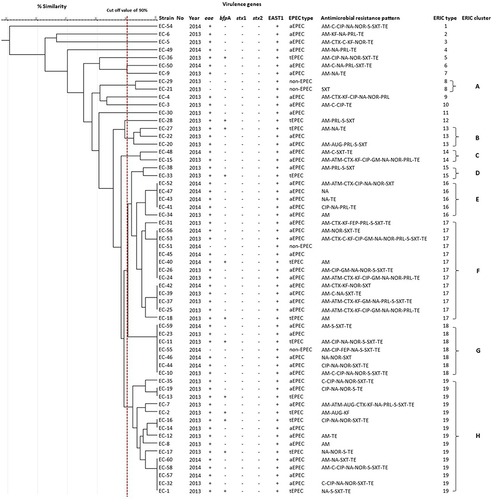
Figure 2 UPGMA dendrogram of the genetic relationships among 60 isolates of EPEC isolated from humans between 2013 and 2014 in the Eastern Province of Saudi Arabia. The arrow above percentage similarity scale indicates the cutoff value of 90% for cluster analysis.